Cardano price prediction: Third-party outlook
Cardano (ADA) is trading at $0.66946 as of 1:54pm (UTC) on 28 October 2025, sitting near the lower edge of its intraday range between $0.65774 and $0.6924, according to Capital.com’s quote feed.
As of 28 October 2025, several factors have influenced Cardano price movements. Cardano has seen increased speculative interest, with open interest in ADA futures recently reaching $2.21m and daily trading volume at $2.76m, indicating stronger market participation (The Tradable, 26 October 2025). Ongoing risk-off sentiment, linked to broader macroeconomic trends and a cautious Federal Reserve outlook, has led to continued consolidation below resistance at $0.68–$0.69, reflected in balanced order book liquidity and subdued DeFi activity (99Bitcoins, 27 October 2025).
Cardano price prediction 2025-2030: Analyst price target view
CoinCodex (algorithmic model update)
CoinCodex projects Cardano within a range of $0.64 to $1 in 2025, with a median forecast of $1.17 for 2026, based on market momentum and network adoption (CoinCodex, 29 October 2025)
Digital Coin Price (platform forecast)
Digital Coin Price expects an average ADA price of $1.25 in 2025, rising to $1.41 in 2026, supported by ecosystem development and scaling milestones (Digital Coin Price, 29 October 2025).
Coinpedia (crypto research service)
Coinpedia forecasts a trading band between $0.85 and $2.05 for 2025, potentially averaging $3 in 2026, depending on broader market conditions. The outlook references long-term smart contract expansion and higher dApp activity (Coinpedia, 27 October 2025).
AInvest (fundamental/ETF scenario)
AInvest identifies ETF approval as a key catalyst, noting ADA’s range between $0.78 and $0.86 in October 2025 and technical resistance near $0.86. The report highlights institutional demand, protocol upgrades and ETF inclusion as possible factors for a $1.03 target by late October, while macroeconomic risks may sustain volatility (AInvest, 4 October 2025).
Consensus forecasts for Cardano in 2025 generally fall within $0.64–$2.05, with some model-based outliers extending towards $5.
Forecasts are shaped by ecosystem growth, technical progress and macroeconomic conditions, but their accuracy remains uncertain. Past performance is not a reliable indicator of future results.
ADA price: Technical overview
Cardano (ADA) is trading near $0.67 as of 1:54pm (UTC) on 29 October 2025, remaining above its 10- and 20-day simple moving averages – approximately 0.6556, 0.6682, 0.78, 0.805 and 0.743 for the 10-, 20-, 50-, 100- and 200-day SMAs respectively. The 20-over-50 alignment indicates short-term stability relative to recent lows. The 20-day EMA at 0.6860 sits about 3% above the equivalent SMA, forming a nearby resistance level.
Momentum remains neutral, with the 14-day RSI at 44.4 and the ADX at 26.5, supporting the existing trend without indicating a reversal. The next resistance area is the Classic Pivot R1 at 0.8808; a daily close above this could bring R2 (1.0306) into view. Immediate support lies at the Classic Pivot (0.8177), followed by the 200-day SMA at 0.743. A drop below these may expose S1 at 0.6811 (TradingView, 28 October 2025).
This technical overview is provided for informational purposes only and does not constitute financial advice or a recommendation to buy or sell any instrument.
Cardano price history
Cardano’s ADA price has seen wide fluctuations over the past two years, tracking broader crypto market sentiment and sector developments. After ending 2023 near $0.60, ADA spent early 2024 consolidating below $0.70, before gaining momentum mid-year as market optimism returned. The token closed May 2024 at $0.44, then rose to $1.15 by late December, reflecting a notable recovery from the Q3 lows.
Momentum eased in early 2025. By 28 October 2025, ADA traded around $0.67, about 14% below its May peak and well off 2024’s high. Volatility remains pronounced – monthly closes have ranged between $0.79 and $0.61, with sharp moves following regulatory or macroeconomic developments. Even so, ADA’s price is around 11% higher year-on-year, underscoring the network’s continued resilience during a challenging period.
Past performance is not a reliable indicator of future results. Share prices are indicative and may differ from live market prices.
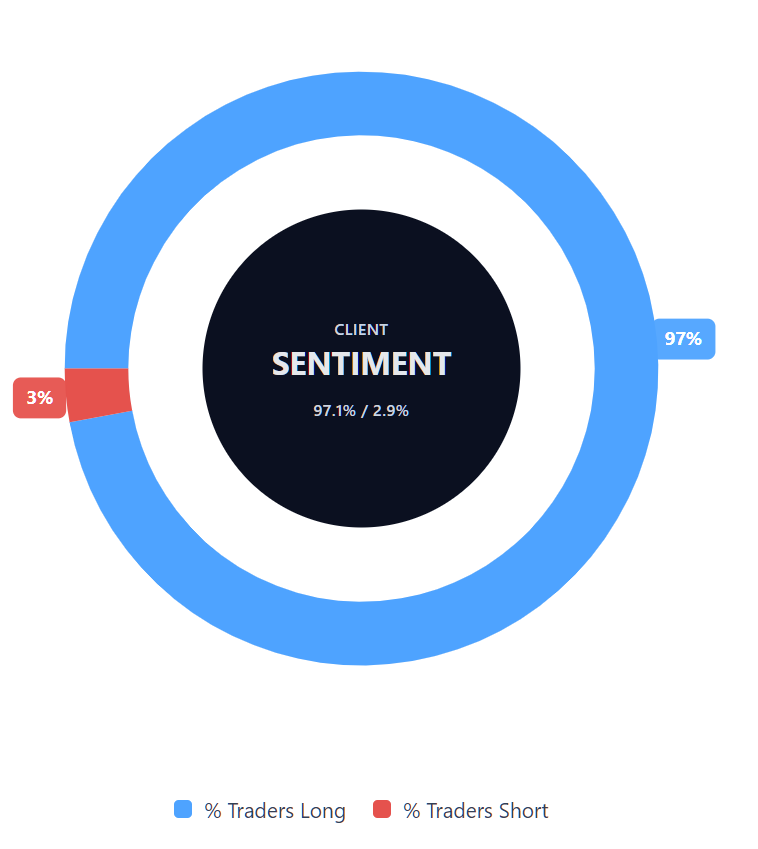
Capital.com’s client sentiment for Cardano CFDs
As of 28 October 2025, Capital.com client positioning in Cardano CFDs shows a strong bias towards long positions, with 97.1% long and 2.9% short – a difference of 94.2 percentage points. This represents open positions on the Capital.com platform and may shift as market conditions change.
FAQ
How many Cardanos are there?
Cardano’s maximum supply is 45 billion ADA, with around 35.85 billion currently in circulation (CoinMarketCap, 29 October 2025). The remaining tokens are released gradually through protocol mechanisms such as staking rewards.
Could Cardano’s price go up or down?
Like all cryptocurrencies, Cardano’s price is influenced by investor sentiment, adoption trends and broader macroeconomic factors. Prices may rise or fall depending on trading activity and overall market conditions. Past performance is not a reliable indicator of future results.
Should I invest in Cardano?
Capital.com does not provide investment advice. Whether to trade CFDs on, or invest directly in, ADA depends on your personal circumstances, risk tolerance and understanding of the market. Always carry out independent research and consider the risks before trading. Contracts for difference (CFDs) are traded on margin – leverage amplifies both profits and losses.
What affects Cardano’s share price?
Cardano’s performance is driven by network development, regulatory changes, institutional participation and market liquidity. Technical indicators and volatility may also influence short-term movements. Past performance is not a reliable indicator of future results.