

Ethereum price prediction: Binance resumes withdrawals after breach
Ethereum’s price moves follow a reported $6.3bn security breach at Binance. Explore third-party ETH forecasts and technical analysis. Past performance is not a reliable indicator of future results.
Ethereum (ETH/USD) is trading at $2,281.30 as of 11:22am UTC on 2 November 2026, within an intraday range of $2,250.35–$2,308.77. Past performance is not a reliable indicator of future results.
Ether and bitcoin recovered modestly following last week's $6.3bn Binance security breach. The exchange subsequently resumed service and said withdrawals were stabilising after an initial spike. Meanwhile, the US dollar weakened ahead of the 3 November midterm elections, with the dollar index falling 0.5% to 101.45 (Reuters, 2 November 2026).
Third-party Ethereum outlook: Binance after $6.3bn breach
Third-party Ethereum predictions, published as of 2 November 2026, include model-based estimates, scenario ranges and conditional technical outlooks. These forecasts are neither a broker consensus nor investment recommendations.
Ethereum price prediction 2026
- CoinDataFlow projects ETH to trade in a range of $1,630.67–$2,482.67 for 2026 (CoinDataFlow, 2 November 2026).
- CoinCodex estimates an average $2,292.09 ETH price for 2026, within a range of $2,077.55–42,436.51 (CoinCodex, 2 November 2026).
- Changelly projects an average Ethereum price of $2,445.39 for December 2026, within a range of $2,305.84–$2,584.94 (Changelly, 1 November 2026).
- Crypto News puts ETH's December 2026 base-case estimate at $2,696.30, with bearish and bullish scenarios of $2,291.86 and $3,235.56 respectively (crypto.news, 2 November 2026).
- Coinpedia outlines a potential recovery towards $2,550 if ETH moves above $2,422 with stronger momentum and buying volume. A decisive close below $2,300 could instead bring support near $2,231 into focus (Coinpedia, 27 October 2026).
Ethereum price prediction 2027
- CoinDataFlow forecasts a 2027 trading range of $1,586.69–$4,168.25, with an average price of $2,877.47, using a model based on Bitcoin's four-year cycle (CoinDataFlow, 2 November 2026).
- Crypto News projects a 2027 base-case price of $3,100.57, with bearish and bullish scenarios of $2,170.40 and $4,340.80 respectively (crypto.news, 2 November 2026).
- CryptoTicker estimates a 2027 average ETH price of $2,246.10, within a range of $976.58–$4,324.80 (CryptoTicker, 2 November 2026).
- CoinCodex estimates an average $3,169.44 ETH price for 2027, within a range of $2,229.80–$3,829.50 (CoinCodex, 2 November 2026).
Ethereum price prediction 2030
- CoinDataFlow projects a 2030 range of $5,349.64–$15,467.39, with an average price of $10,408.52, using cycle-based modelling (CoinDataFlow, 2 November 2026).
- Crypto News models a 2030 base-case price of $7,349.50, with bearish and bullish scenarios of $5,144.65 and $10,289.31 respectively (crypto.news, 2 November 2026).
- CoinCodex estimates an average $3,965.91 ETH price for 2030, within a range of $2,893.45–$4,959.25 (CoinCodex, 2 November 2026).
- Changelly forecasts a 2030 average ETH price of $3,924.93, within a range of $2,865.66–$4,926.26 (Changelly, 1 November 2026).
- CryptoTicker forecasts a 2030 average price of $2,905.60, within a range of $464.85–$11,006 (CryptoTicker, 2 November 2026).
Third-party Ethereum forecasts and predictions are inherently uncertain, as they cannot fully account for unexpected market developments. Past performance is not a reliable indicator of future results.
Ethereum technical analysis
The ETH/USD price trades at $2,281.30 as of 11:22am UTC on 2 November 2026, below its 20-, 50- and 100-day simple moving averages (SMAs), at approximately $2,359, $2,512 and $2,349 respectively. The price remains above the 200-day SMA near $2,157.
The 14-day relative strength index (RSI) reads 36.42, indicating relatively weak momentum without reaching oversold territory. The average directional index (ADX) stands at 31.17, suggesting an established trend without indicating its direction.
On the upside, the classic pivot at $2,400 provides an initial resistance reference, followed by R1 at $2,627 and R2 at $3,002. A move above these levels could bring higher resistance levels into focus.
On the downside, the 200-day SMA near $2,157 provides a potential support reference, followed by the classic S1 pivot at $2,025. A break below these levels could indicate further weakness, while a recovery towards the shorter-term averages may change the technical picture (TradingView, 2 November 2026).
This is technical analysis for informational purposes only and does not constitute financial advice or a recommendation to buy or sell any instrument.
Ethereum price history (2024–2026)
ETH/USD’s price traded around $2,500 in early November 2024 before rising to approximately $4,108 in mid-December. The price then eased, ending the year near $3,342.
The decline continued into 2025, with ETH reaching an intraday low of around $1,387 on 9 April. A recovery through spring and summer took the token to a record high near $4,950 on 24 August, before a decline over the following months. Ethereum ended 2025 near $2,970.
ETH opened 2026 around $2,970 and reached a January high near $3,400 before falling through the first half of the year. The token declined to approximately $1,506 in June, then recovered through July and August, moving above $2,800 in September.
October brought further declines, with ETH falling to around $2,180 before ending the month near $2,253. At $2,281.30 on 2 November 2026, ETH remained below its late-2025 highs but above its June 2026 low.

Past performance is not a reliable indicator of future results. Prices are indicative and may differ from live market prices.
Latest Ethereum news and developments
$6.3bn Binance hack
Ethereum trades near $2,281.30 as of 11:22am UTC on 2 November 2026, following cryptocurrency market volatility linked to the $6.3bn Binance security breach. Ether recovered modestly as the exchange resumed service and reported that withdrawals were stabilising after an initial spike (Reuters, 2 November 2026).
Ethereum ETF outflows
Meanwhile, US spot Ethereum exchange-traded funds (ETFs) recorded net outflows of approximately $431m during 26–30 October, marking five consecutive trading days of withdrawals (Decrypt, 1 November 2026). October outflows totalled around $1.61bn, the largest monthly withdrawal since the funds launched in July 2024 (Yahoo Finance, 2 November 2026).
2026 US midterm elections
Markets were also preparing for the 3 November US midterm elections, with the dollar index falling amid policy uncertainty. ETF flows, exchange-security concerns and election developments could influence cryptocurrency sentiment, although their effect on ETH's price remains uncertain (Reuters, 2 November 2026).
Capital.com analyst view: Ethereum
Continued outflows from US spot Ethereum ETFs could weigh on demand for ETH, while stabilising or recovering flows may provide support. Increased staking could reduce the amount of ETH readily available for trading, while withdrawals make staked tokens available again without necessarily leading to sales (Ethereum.org, accessed 2 November 2026). Regulatory changes could affect institutional access and compliance costs.
Monetary policy, political developments and broader market sentiment may also influence ETH's price (Reuters, 2 November 2026). Ethereum has historically experienced substantial price movements in both directions, while neither technical indicators nor third-party forecasts can reliably predict future performance.
Capital.com’s client sentiment for Ethereum CFDs
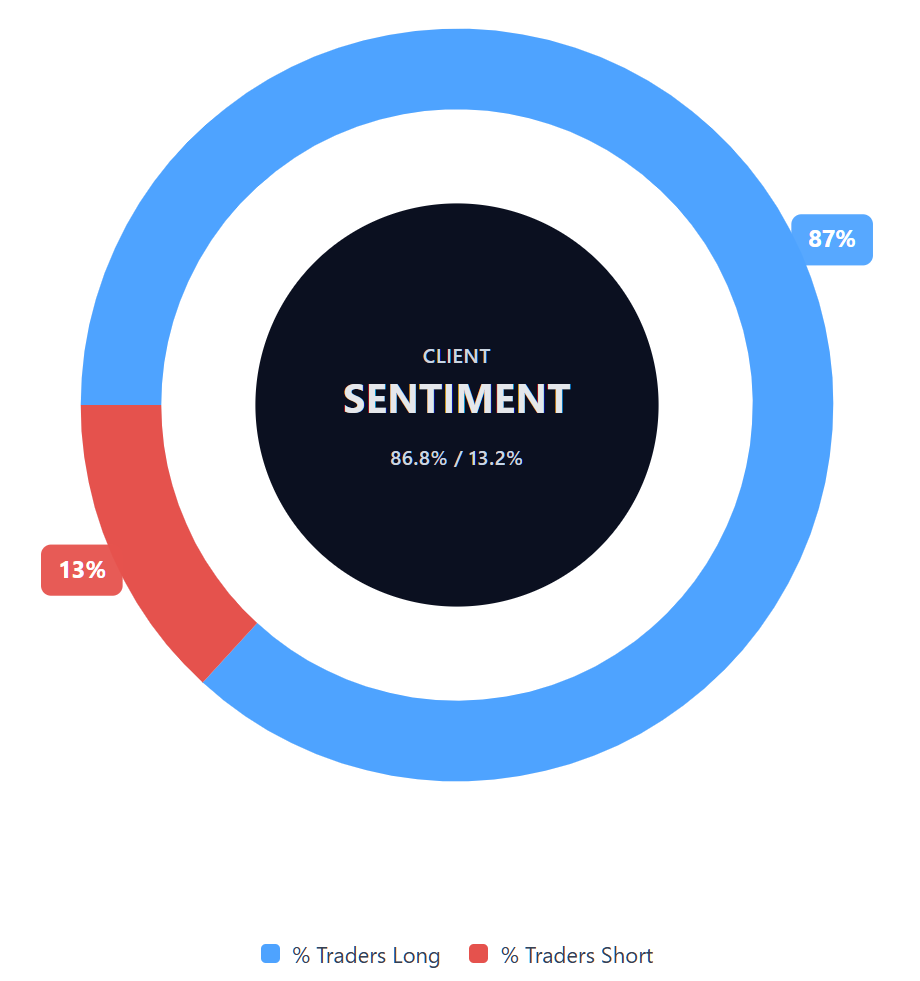
As of 2 November 2026, Capital.com client positioning in Ethereum CFDs shows 86.8% buyers and 13.2% sellers, a difference of 73.6 percentage points. This snapshot reflects open positions on Capital.com as of 2 November 2026 and can change. It does not predict future price movements.
Summary – Ethereum (2026)
- Ethereum traded at $2,281.30 at 11:22am UTC on 2 November 2026, within an intraday range of $2,250.35–$2,308.77.
- According to TradingView data, technical readings show ETH below its 20-, 50- and 100-day SMAs but above the 200-day average, with a 14-day RSI of 36.42 and ADX of 31.17.
- Third-party forecasts and scenarios extend from $1,763.18 to $3,235.56, using different time horizons and methodologies.
- Potential price influences include ETF flows, exchange-security concerns, staking activity, regulation and broader economic conditions, with possible effects in either direction.
- Recent developments include the $6.3bn Binance breach, continued US spot Ethereum ETF outflows and positioning ahead of the 3 November US midterm elections.
Past performance is not a reliable indicator of future results.