Bollinger Bands explained: A comprehensive guide to trading with volatility

To use the Bollinger Bands trading strategy, it’s important to understand how they’re constructed and interpreted before applying them in your analysis or decision-making.
What are Bollinger Bands?
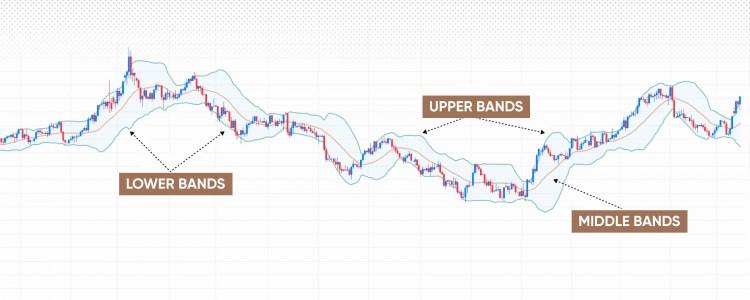
John Bollinger developed Bollinger Bands® in 1983, introducing a volatility-based envelope designed to track price movement. The bands consist of three lines: a simple moving average at the centre, and upper and lower bands positioned a set number of standard deviations above and below it. They suggest whether price levels are relatively high or low and adjust automatically as market volatility changes.
How Bollinger Bands form
Bollinger Bands® have three main components, each with a specific function.
Past performance is not a reliable indicator of future results
The middle band is the foundation. It’s a simple moving average (SMA) of the closing price over a defined number of periods. The default setting is a 20-period SMA, representing the average of the last 20 candles. The middle band serves as a reference point, as prices often move back towards this line, reflecting the principle of mean reversion.
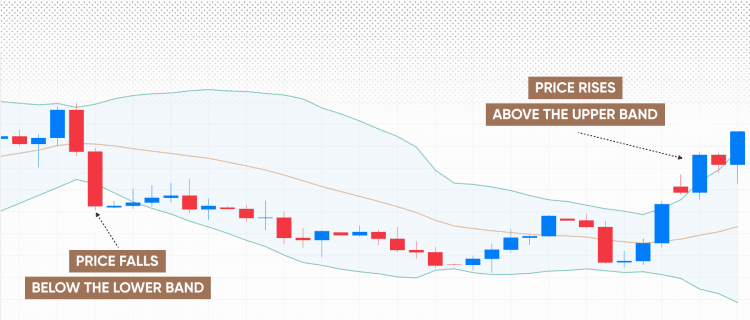
The upper band is plotted above the middle band. Its distance is determined by the standard deviation, a statistical measure of price volatility. The default setting is two standard deviations, which in a normal distribution covers around 95% of price movements. When price reaches or moves above the upper band, it can indicate that buying momentum is slowing.
The lower band is plotted below the middle band at the same two-standard-deviation distance. When price reaches or moves below it, it can signal that selling pressure is easing.
Standard deviation is what makes Bollinger Bands dynamic: higher volatility widens the bands, while lower volatility narrows them.
See how Bollinger Bands perform in real market conditions without financial risk by opening a free demo account.
How Bollinger Bands work
The key advantage of Bollinger Bands® is their ability to adjust to changing market conditions. They visually represent volatility: when the market is calm, the bands contract, showing limited price movement and a narrow trading range. During periods of higher volatility, the bands expand, reflecting wider price swings and an increased range. This dynamic display of volatility is one of the main benefits of the Bollinger Bands indicator.
Price typically moves within the bands, with around 95% of price action occurring between the upper and lower limits under a normal distribution assumption. When price approaches either band, it may suggest that the market is at a relative extreme and could be stabilising or preparing to change direction. However, a touch of the upper band doesn’t imply a decline, nor does contact with the lower band imply a rise. Other indicators are often used to confirm potential signals.
Past performance is not a reliable indicator of future results
Setting up Bollinger Bands
The widely used default settings for Bollinger Bands® are a 20-period simple moving average (SMA) and two standard deviations. This represents about a month of trading sessions.
These parameters can be adjusted to suit different markets and timeframes. Reducing the SMA period to 10 makes the bands more responsive to price changes, while extending it to 50 makes them smoother and less reactive to short-term fluctuations.
Adjusting the standard-deviation multiplier also affects the frequency and strength of signals. Using 1.5 standard deviations tightens the bands, increasing the number of touches and potential signals. Using 3 standard deviations widens them, resulting in fewer touches but often with stronger contextual significance.
Although the middle band is usually an SMA, some traders prefer an exponential moving average (EMA) to give more weight to recent prices, allowing the bands to adjust more quickly. However, the standard SMA settings are generally suitable for most analytical approaches.
Bollinger Bands across markets & timeframes
The Bollinger Bands® indicator is adaptable across a range of markets and timeframes:
Different timeframes align with distinct trading styles:
- Day trading: on short intervals (1m, 5m, 15m), bands are highly responsive and potentially used to spot quick touches and short-term movements.
- Swing trading: on medium intervals (1H, 4H), signals tend to be clearer and more consistent, potentially supporting positions held over several hours or days.
- Position trading: on long-term analysis (daily or weekly charts), bands can highlight broader trend changes, though signals may appear less frequently.
Explore more about trading different asset classes in our market guides.
Popular Bollinger Band strategies
There are several ways to apply the Bollinger Bands® indicator in market analysis.
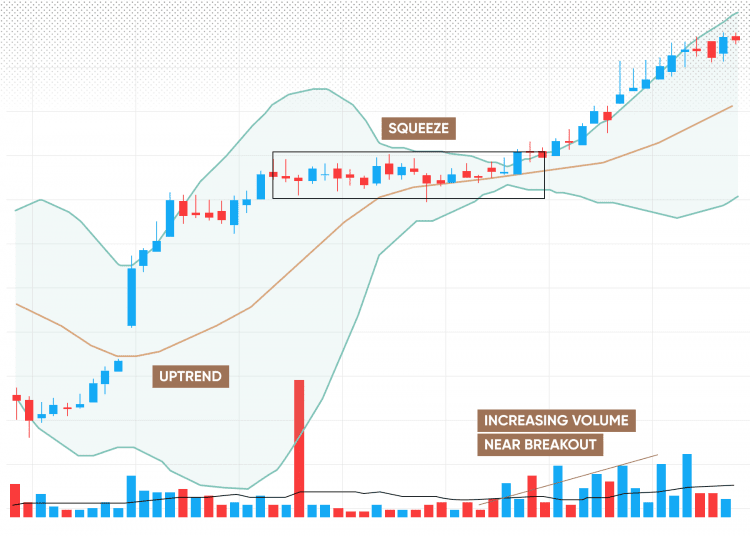
Bollinger Band squeeze
This mean reversion approach assumes that price often returns to the middle band after touching an outer band. It’s generally most effective in ranging markets. A touch of the upper band can suggest that buying momentum is slowing, while a touch of the lower band can indicate that selling pressure is easing. Traders often use additional indicators, such as relative strength index (RSI), to support potential signals and help filter noise.
Past performance is not a reliable indicator of future results
Bollinger bounce strategy
This mean-reversion approach assumes that price will revert to the middle band after touching an outer band. It is most effective in ranging markets. A touch of the upper band may present a short opportunity, while a touch of the lower band may indicate a long opportunity. Traders often look for additional confirmation (such as divergence on RSI) to reduce false signals.
Bollinger Band walk strategy
During sustained trends, price may 'walk the band' – staying close to the upper band in an uptrend or the lower band in a downtrend. This reflects strong, persistent momentum. In these conditions, counter-trend interpretations are less reliable, while trend trading strategies may be more applicable.
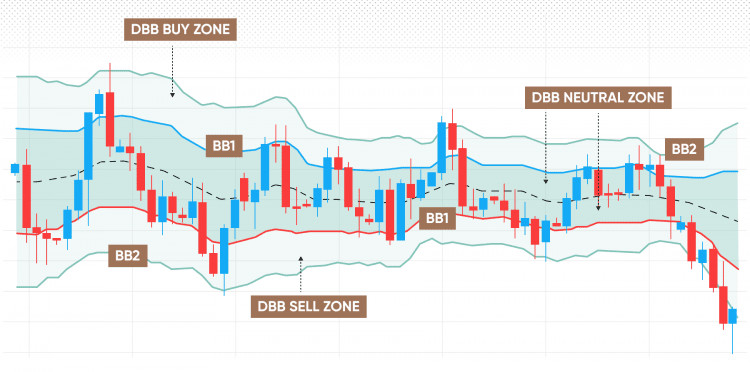
Double Bollinger Bands strategy
Some experienced traders use two sets of Bollinger Bands, commonly set at one and two standard deviations. The area between the two upper bands can represent a potential buy zone, while the area between the two lower bands can represent a potential sell zone. This setup can help identify varying degrees of volatility and refine entry or exit points.
Past performance is not a reliable indicator of future results
Combining Bollinger Bands with other indicators
No indicator should be used in isolation. Complementary tools can provide additional context and confirmation. Here’s how Bollinger Bands® can be paired with other commonly used technical indicators.
Bollinger Bands + RSI
The RSI is a momentum oscillator, typically set to 14 periods, that helps identify overbought (above 70) and oversold (below 30) conditions. When price reaches the upper Bollinger Band and RSI is above 70, it may indicate that the market is overextended to the upside. Conversely, when price touches the lower band with RSI below 30, it can suggest the market is oversold or losing downward momentum.
Bollinger Bands + MACD
The moving average convergence divergence (MACD) is a trend-following indicator comparing two exponential moving averages (EMAs) and a signal line. A bearish crossover (MACD line moving below the signal line) after price approaches the upper band may point to slowing upward momentum. Similarly, a bullish crossover following contact with the lower band may indicate building strength. This combination can help filter out less reliable reversal indications by aligning price extremes with momentum shifts.
Bollinger Bands + volume
Volume reflects the level of market participation. A breakout from a Bollinger Band squeeze that occurs alongside higher-than-average volume can suggest stronger participation behind the move. In contrast, low-volume breakouts are often less dependable. Likewise, changes in volume can help assess the validity of potential reversals when used alongside other indicators.
Learn more about using technical indicators in your market analysis.
Bollinger Bands in swing vs day trading
How Bollinger Bands® are applied depends on trading style.
For day trading, you may wish to use shorter timeframes to identify quick price movements. A common method is the Bollinger Band bounce, where positions are opened near the lower or upper band and closed around the middle band. These trades usually target smaller, more frequent profits, so tight stop-losses are often used to help manage risk. Bands plotted on short intervals are generally more responsive to market changes.
For swing trading, you might focus on broader price movements lasting several days or weeks. Strategies often centre on squeezes and subsequent breakouts, aiming to identify emerging trends. Bands can also assist in trade management – for instance, exiting a position when price reaches the opposite band. Signals on longer timeframes tend to be clearer and less frequent, providing a wider market perspective.
Discover more CFD trading strategies.
Real-word examples
Here are a few scenarios that illustrate how Bollinger Bands® can be applied in practice.
Case study 1: Squeeze and breakout
For instance, a large-cap technology stock entered a prolonged consolidation phase, with the bands narrowing significantly to reflect reduced volatility. When price closed above the upper band on higher-than-average volume, it indicated the start of a potential upward move. The trend continued for several weeks, highlighting how expanding bands can accompany a volatility shift.
Case study 2: Reversal
Consider the EUR/USD pair, which experienced a sharp decline that brought price to the lower band while the RS) dropped below 30. This combination suggested an oversold market condition. Price later moved back towards the middle band, showing how mean reversion can occur following an extended move.
Case study 3: Failed signal
In a sideways market, price touched the lower band but failed to recover, instead remaining within a narrow range as the bands stayed compressed. This limited response, combined with low volatility and weak trend confirmation, highlights the need for additional indicators and broader market context when interpreting Bollinger Bands.
Past performance is not a reliable indicator of future results.
Common mistakes and misinterpretations
Even with a clear approach, some traders may misapply Bollinger Bands®. One frequent error is placing too much weight on a single signal. A touch of the upper band is not automatically a sell indication – it simply highlights a potential price extreme and should be confirmed with additional analysis.
Another common issue is misinterpreting the squeeze. A Bollinger Band squeeze doesn’t always lead to an immediate breakout; markets can remain compressed for extended periods. Waiting for confirmation before acting helps ensure a more measured interpretation.
A further oversight is ignoring broader market conditions. Bollinger Bands tend to be more informative in clearly trending or well-defined ranging markets, and less effective in choppy or directionless environments. It’s important to evaluate the overall context when interpreting Bollinger Band signals.
Limitations of Bollinger Bands
The Bollinger Bands® indicator is widely used and adaptable, but it does have certain limitations.
Firstly, it is reactive rather than predictive. The bands reflect current volatility but do not forecast future price movements. During sharp trend changes, the simple moving average (SMA) can lag, causing the bands to expand after rapid price shifts, which may delay subsequent signals.
Secondly, in sideways or low-volatility markets, Bollinger Bands can produce frequent or misleading signals. Price may move repeatedly between the bands without establishing a clear direction, resulting in inconsistent readings.
Learn more about trading essentials to build a broader understanding of market behaviour.
Risk management when using Bollinger Bands
Sound risk management is central to using Bollinger Bands® effectively. The first step is to set an appropriate stop-loss order to help limit losses if the market moves unfavourably. A common method is to place the stop-loss slightly beyond the opposite band – this acts as a buffer and helps invalidate the setup if price closes outside it.*
Position sizing should also account for volatility. When the bands are wide, indicating heightened volatility, smaller position sizes can help reduce potential drawdowns. When the bands are narrow and volatility is low, modest size adjustments may be more appropriate. Some traders use the average true range (ATR) to measure volatility and align position size accordingly.
Finally, trade management should adapt to the prevailing market environment. During a squeeze, it may be prudent to wait for a confirmed breakout rather than entering early. In a sustained trend, where price tends to 'walk the band,' traders might use trailing stop-losses – for example, along the SMA or based on a percentage of ATR – to help manage exposure as momentum continues.
*Standard stop-loss orders are not guaranteed, while guaranteed stop-loss orders incur a fee if activated.
Advanced tips for experienced traders
For more experienced traders, Bollinger Bands® can be applied in more advanced analytical setups.
Algorithmic trading
Bollinger Bands can integrate effectively into an algorithmic trading approach. You may develop rule-based models for squeezes, confirmed breakouts (for example, a close beyond a band combined with a volume filter) or band-based entries, and then backtest them on historical data to assess consistency and behaviour across market conditions.
Fine-tuning bands with different assets
Settings can be optimised for individual instruments through structured backtesting. For instance, a high-volatility share might respond better to a 15-period SMA and 2.5 standard deviations, while a low-volatility currency pair may suit a 30-period SMA and 1.75 standard deviations. The optimal configuration depends on each asset’s volatility profile and preferred timeframe.
Bollinger Bands vs MACD
Bollinger Bands measure volatility envelopes around price, whereas the MACD tracks momentum through EMA crossovers and histogram changes. Used together, a MACD crossover that aligns with a Bollinger Band breakout or bounce can provide additional confirmation by aligning price volatility with momentum shifts.
Past performance is not a reliable indicator of future results.
Create an account Open a demo account
FAQ
What are Bollinger Bands?
Bollinger Bands® are a technical indicator made up of three lines: a simple moving average (SMA) in the centre, with upper and lower bands plotted a set number of standard deviations above and below it. They help illustrate volatility and show whether prices are relatively high or low within a specific period.
How do Bollinger Bands work?
Bollinger Bands expand and contract in response to changes in market volatility. When volatility increases, the bands widen; when it decreases, they narrow. Prices usually move within the bands, and touches of the upper or lower band may indicate potential market extremes, though these require further confirmation from other indicators.
What are the best Bollinger Band settings?
The default settings – a 20-period SMA and two standard deviations – are widely used. However, these parameters can be adjusted to suit an asset’s volatility or timeframe. Shorter periods make the bands more responsive, while longer periods help smooth short-term fluctuations.
What is a Bollinger Band squeeze?
A squeeze occurs when the bands contract sharply, signalling a period of low volatility. This can precede a potential expansion in price movement, though the direction of the move is not predetermined. Many traders wait for a confirmed breakout before interpreting it as a change in volatility conditions.
Can Bollinger Bands be used with other indicators?
Yes. Bollinger Bands are often combined with complementary tools such as RSI, MACD, or volume to add context. For instance, an RSI divergence near a Bollinger Band touch may help identify overextended conditions, while a MACD crossover aligned with a band breakout can offer additional confirmation of momentum shifts.