Understanding the exponential moving average (EMA): a comprehensive trader’s guide
What is the exponential moving average (EMA)?
This indicator is a line on a price chart that smooths out price data. It helps you see the trend more clearly. EMA is a type of moving average, which means it basically calculates the average price of an asset over a specific period. However, it is different from other moving averages because it uses a weighting method. EMA gives more weight to the most recent prices. This helps the indicator react to new information very quickly.
This is the main difference between EMA vs SMA. The simple moving average (SMA) treats all prices in a period equally. So, a 10-day SMA will treat the first day’s price and the tenth day’s price the same. However, EMA gives recent prices more importance, making it a ‘faster’ line. EMA follows the price more closely than the SMA. This is a big advantage for active traders.
Past performance is not a reliable indicator of future results.
Real-world relevance and usage
EMA is one of the most popular indicators. Traders use it for 3 main things. Firstly, they use it to spot trends. If the price is above the EMA, it is an uptrend. Secondly, they use it to find support and resistance levels, since the EMA line often acts as a price floor or ceiling. Thirdly, traders use EMA to identify entry and exit points. The indicator gives clear signals for when to buy or sell.
Learn to interpret the EMA line on real price charts without risking real money. Open a demo account.
EMA formula and how to calculate it
EMA calculation is more complex than SMA. Fortunately, you don’t need to calculate it yourself. Your trading platform will do it for you and place the line on your price chart. However, understanding the formula helps you understand how this indicator works.
The formula to calculate EMA is:
Here:
- Closing price is the last traded price of the period. For example, on a daily chart, it is the closing candlestick of the day.
- Previous EMA is the EMA value for the prior period
- Multiplier is the smoothing constant. Its value is determined by the number of periods you use (n).
Smoothing factor: multiplier is the most important part of the formula
It is often represented as α (alpha) and ensure that more weight is given to recent prices.
Calculating the smoothing factor:
- Choose EMA length (N): such as a 10-day or 50-day EMA
- Use the formula: α = 2 / (N + 1)
- Understand the result: The alpha (α) is a percentage applied to the closing price and combined with the previous EMA value to calculate the new EMA
For example, for a 10-day EMA, N = 10
So, α will be: 2 / (10 + 1) = 2 / 11 = 0.1818
This means about 18% of the new EMA’s value comes from the closing price.
Smaller EMA periods have a larger α (reacts much faster), while larger EMA periods have a smaller α. It reacts more slowly and is smoother.
EMA vs exponentially weighted moving average (EWMA): used interchangeably
They both refer to the same mathematical calculation. This calculation gives more weight to recent data points.
How to use EMA in trading
EMA is a flexible tool. There are many ways to use it. Here’s what you must know to learn how to use EMA in trading.
Spotting trends with EMA
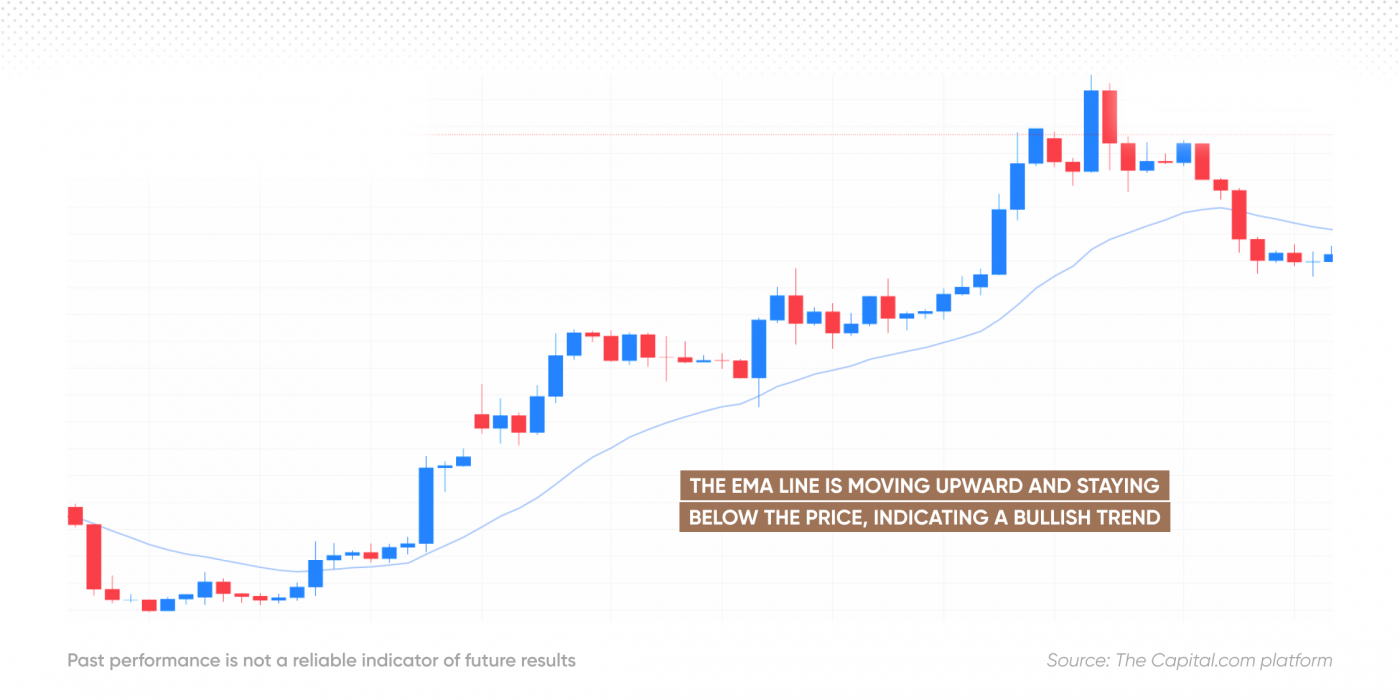
The EMA is a popular indicator for trend trading. It clearly shows the market’s direction. During an uptrend, the price consistently stays above the EMA line, while the EMA line itself keeps rising. In a downtrend, the price remains below the EMA line, with the EMA line falling. In sideways markets, the price crosses the EMA line frequently, while the EMA line stays flat or moves horizontally.
Entry and exit timing using EMA
Traders use EMA to time their trades. When the price crosses above a rising EMA or drops to a rising EMA line and bounces up, it is seen as a signal to buy. When the price crosses below a falling EMA or rises to a falling EMA and is rejected, it is taken as a sell signal.
Common EMA values
Choose EMA periods based on your trading strategy. Each period has a different purpose.
| EMA Value | Common Use | Context |
|---|---|---|
| 9 or 10 | Short-term/quick trend | Fast signals, scalping, or aggressive trading. |
| 20 or 21 | Short-term trend | Used for the main trading period and volatility measurement. |
| 50 | Medium-term trend | Popular among swing traders and for moderate trend strength. |
| 100 | Long-term trend | Important for position traders and significant support/resistance. |
| 200 | Major long-term trend | The most important line. It defines the major market cycle. |
Choosing the right EMA for your strategy
Your trading style determines your choice.
- Day traders/scalpers: use shorter EMAs (9 or 20) for fast signals on short timeframes (like 5-minute charts).
- Swing traders: use medium-term EMAs (50 or 100) for less noise on daily or 4-hour charts.
- Position traders: use long-term EMAs (200) to see the big picture trend.
EMA trading strategies
Different strategies use EMA in different ways. Consider combining EMA with other technical indicators for signal confirmation.
However, these strategies do not guarantee profits, and past performance does not guarantee future results.
EMA crossover strategy
EMA crossover is the most popular strategy. It uses a fast EMA and a slow one.
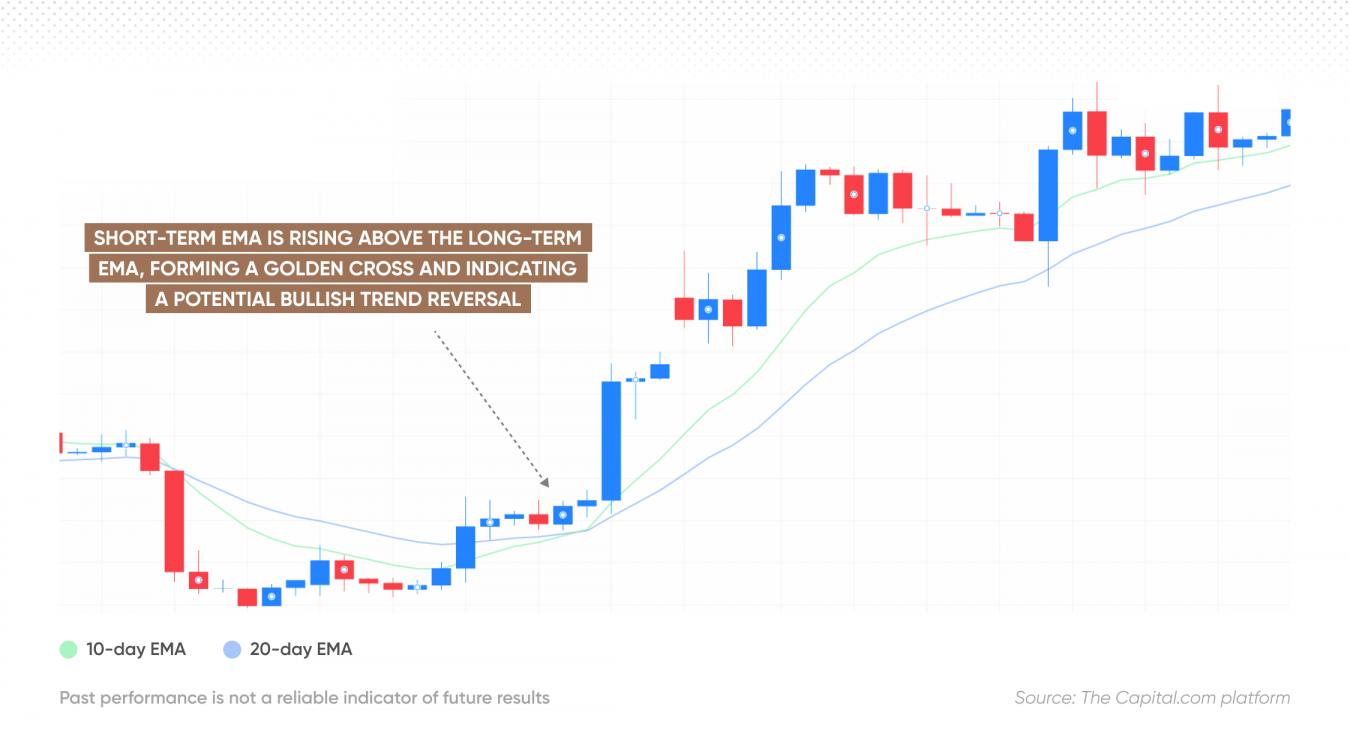
- Golden cross (buy signal): faster EMA crosses above slower EMA, suggesting a major uptrend is starting.
- Death cross (sell signal): faster EMA crosses below slower EMA, signalling the start of a major downtrend.
Shorter periods, like 9-EMA and 21-EMA, are used for faster signals. This is common in an aggressive EMA trading strategy.
Past performance is not a reliable indicator of future results.
EMA + RSI confirmation strategy
Use EMA to identify the trend and RSI to confirm the momentum. This is an effective RSI EMA strategy.
- Step 1: trend check: use 50-EMA to identify the trend. Buy when the price is above the 50-EMA.
- Step 2: momentum check: wait for the price to pull back toward the 50-EMA.
- Step 3: confirmation: enter the trade when the RSI is below (but not oversold) and starts moving up. This confirms that the selling pressure is ending, and momentum is returning to the uptrend.
EMA as dynamic support/resistance
The EMA line rarely stays flat. It moves with the market, which is why it is called a dynamic level.
During an uptrend, a rising EMA (like the 20-EMA) acts as dynamic support. Traders buy when the price pulls back to this line. In a downtrend, a falling EMA (like the 20-EMA) acts as dynamic resistance. Traders sell when the price rallies to this line.
Trend-following strategy using 200 EMA
The 200-day EMA is the most respected moving average. It shows the long-term health of an asset. The golden rule for the trend-following strategy is to only open long trades when the price is above the 200-EMA. Short trades are opened only when the price is below the 200-EMA. This strategy helps a trader stay on the right side of the major trend. It prevents buying into a long-term decline.
Combining EMA with other indicators
EMA works best when used with other indicators to confirm signals. This helps avoid false signals.
EMA + MACD
Moving average convergence divergence (MACD) is built using EMAs. It measures the distance between two EMAs. Here, you can use the EMA to find the trend direction and the MACD histogram to find the momentum to enter the trade. For example, if the 50-EMA is trending up, only enter a long trade when the MACD crosses above its signal line.
EMA + RSI
The RSI EMA strategy is discussed above. Here, the EMA shows direction, and RSI shows momentum and overbought/oversold conditions.
EMA + volume or price action
When the price bounces off the 200-EMA with high volume, it is considered a very strong signal. High volume confirms strong institutional interest at that level.
For price action, look for candlestick patterns at the EMA. A hammer or a bullish engulfing pattern at the 20-EMA support line is a high-probability entry signal.
Advanced EMA concepts and variants
Experienced traders can try more complex EMA variants. They try to reduce lag even further.
Double EMA (DEMA)
DEMA attempts to remove the inherent delay (lag) of a standard EMA. It uses 2 EMAs in its formula. It is a much faster-acting line than the standard EMA.
Triple EMA (TEMA)
TEMA is an even more aggressive variant. It uses 3 EMAs to further reduce lag. TEMA follows the price very closely and is great for fast-moving markets. However, it can be noisy.
EMA with volatility filters
In a choppy market, EMA can give many false signals (whipsaws). A volatility filter helps. Traders often use the average true range (ATR) to filter EMA signals. This makes the system only open trades when the market is clearly moving.
Anchored EMA
The Anchored EMA (AEMA) starts its calculation from a significant date or price event. This could be a market crash or a major earnings report. It is a fixed, long-term benchmark.
Where and when to use these variants
DEMA and TEMA are popularly used for short-term trading strategies (like scalping) on low timeframes. They react very fast. Anchored EMA is used for long-term analysis. It shows the average price paid since a major event.
EMA in different market contexts
EMA works on almost every type of market, although its settings might need slight adjustments.
Forex trading
EMA is extremely popular in forex trading. The currency markets trade 24 hours a day. The 20-EMA on the 1-hour or 4-hour chart is popular. The 9-EMA and 21-EMA crossover is a standard strategy.
Stock trading
The 50-day EMA and 200-day EMA are the most commonly used in stock trading. Institutions watch these lines closely. A move below the 200-day EMA is often a major bearish sign for a stock.
Cryptocurrencies
The crypto markets are highly volatile. This makes a traditional SMA too slow. The fast-reacting EMA is ideal here. Shorter EMAs like the 9, 12, and 26-period EMAs are common on lower timeframes.
Commodities
Commodities tend to trend strongly. The 50-EMA is excellent for riding these trends. It acts as a reliable dynamic support during strong bull runs in gold or oil.
Market-specific behaviour and timeframes
The main rule is to use a longer EMA for a longer timeframe. The 20-day EMA on a daily chart is a 20-day average. The 20-period EMA on a 5-minute chart is only a 100-minute average (20x5). Always adjust your period to your chosen timeframe.
Strengths and limitations of the EMA
No indicator is perfect. It is important to know the pros and cons. The advantage of the EMA is that it reacts faster to price changes. This reduces lag and gives traders earlier signals than the SMA. Also, it is excellent for trend-following strategies. Its speed allows traders to catch trends early and ride them for longer. Plus, it works well in all timeframes. It works just as well on 1-minute charts as it does on monthly charts.
However, EMA does have some limitations. It is prone to whipsaws in choppy markets. Its fast reaction causes many false signals when the price is moving sideways. In addition, it may give false signals without confirmation. This is why it is best to confirm signals with other indicators, such as RSI or volume.
Real-world applications and case studies
History shows the power of key EMA levels.
During the 2008 financial crisis, the S&P index decisively broke below its 200-week EMA. This was a massive signal. It confirmed that the long-term bull market was over. It marked the start of a deep recessionary bear market.
During the major bitcoin bull runs, BTC price rarely closed below the 21-week EMA. This line was the critical dynamic support. Traders who bought every time the price touched this line often had excellent returns.
The 50-day and 200-day EMAs are often self-fulfilling. Many traders watch them. When a price touches the 200-EMA, a massive surge of buying or selling often happens. This is because so many people are using the same line for their trades.
Past performance is not a reliable indicator of future results.
Practical tips for using EMA efficiently
Using the EMA effectively is all about proper setup and discipline.
Platform-specific settings
Popular platforms like TradingView and MT4 allow you to change the EMA period. Use the ‘Close’ price for your calculation. Also, be sure to select ‘Exponential’ instead of ‘Simple’ when adding the indicator.
Optimising EMA periods
Do not simply use the default settings. Test different periods (10, 21, 55, 100) on the asset you trade. Find the EMA that this asset respects most often. This is called ‘optimisation.’
Avoiding lag with faster EMAs
Use faster EMAs (like 9 or 12) to give you an early warning. Use a slower EMA (like 50) to confirm the main trend.
Creating alert-based trading rules with EMA
Set up alerts on your platform. This way, you don’t need to constantly check the chart. Create a rule like: ‘alert me when the 9-EMA crosses the 21-EMA on the 4-hour chart.’ This ensures you only trade when your EMA trading strategy is triggered.
Ready to apply your EMA trading strategy on the real markets? Open a live account.