TotalEnergies stock forecast: DF power deal, dividend effect
TotalEnergies is a France-based energy company whose shares are being watched after a 12-year EDF power deal, a $928m shift into LNG and upstream projects, and its recent ex-dividend date. Past performance is not a reliable indicator of future results. Explore third-party TTE price targets.
TotalEnergies SA (TTE) is trading at €79.65 as of 4:19pm UTC on 2 April 2026, within an intraday range of €77.03–€80.11 on Capital.com's quote feed. Past performance is not a reliable indicator of future results.
Several drivers are shaping price action. Brent crude spiked above $100 per barrel after President Trump urged nations to reopen the Strait of Hormuz in a prime-time address, lifting energy sector sentiment broadly, though subsequent comments suggesting a near-term end to the Iran conflict introduced intraday volatility (Reuters, 2 April 2026). At the company level, TotalEnergies confirmed on 27 March 2026 a 12-year nuclear power allocation contract with EDF to supply low-carbon electricity to its refining and chemicals sites in France from January 2028 (TotalEnergies, 27 March 2026), while earlier in March the company announced that it had redirected approximately $928 million from US offshore wind projects toward LNG and upstream oil and gas development (Reuters, 23 March 2026). The stock also went ex-dividend on 31 March 2026, with a quarterly dividend of €0.85 per share paid on 2 April 2026, which can exert mechanical downward pressure on the share price at the session open (Reuters, 11 February 2026).
TotalEnergies stock forecast 2026–2030: Third-party price targets
As of 2 April 2026, third-party TotalEnergies stock predictions reflect higher oil price assumptions, strong free cash flow projections, and a sector-wide re-rating amid elevated Middle East supply risk. The following targets summarise third-party broker views published within that window.
Barclays (Buy, raised target)
Barclays analyst Lydia Rainforth maintains a Buy rating on TotalEnergies, setting a TTE stock forecast of €94. The firm notes ongoing confidence in TotalEnergies' refining margin resilience and upstream growth pipeline amid tighter global supply conditions (The Globe and Mail, 1 April 2026).
TD Cowen (upgrade to Buy, raised target)
TD Cowen upgrades TTE from Hold to Buy and raises its 12-month price target to $97 from $66. The firm names TotalEnergies its top pick among integrated oil companies, citing a projected production growth rate of approximately 3% annually through 2030 and peer-leading free cash flow expansion (Investing.com, 18 March 2026).
J.P. Morgan (Buy, maintained target)
J.P. Morgan analyst Matthew Lofting maintains a Buy rating on TTE and makes a marginal upward revision to the price target, moving it to $86.74 from $86.49. The adjustment reflects a minor recalibration of earnings estimates, while the broader Buy thesis, anchored in oil leverage and strong cash flow conversion, remains intact (Futu News, 18 March 2026).
MarketBeat (consensus tracker)
MarketBeat reports that TTE reached a new 52-week high in London trading, with shares touching GBX 79.09 intraday on volume of approximately 1.17 million shares. The note places the move in the context of recent broker upgrades and a broader constructive re-rating across the integrated oil sector (MarketBeat, 26 March 2026).
Public.com (consensus overview)
Public.com aggregates five analyst price targets for TTE, placing the consensus 12-month average at $72.56 with a Hold rating. The range spans from a low of $60.80 to a high of $92, reflecting diverging views on the direction of oil prices and the pace of TotalEnergies' energy transition spending (Public.com, 30 March 2026).
Predictions and third-party forecasts are inherently uncertain, as they cannot fully account for unexpected market developments. Past performance is not a reliable indicator of future results.
TTE stock price: Technical overview
The TotalEnergies stock price trades at €79.65 as of 4:19pm UTC on 2 April 2026, holding above a broad moving-average cluster where the 20-, 50-, 100- and 200-day SMAs stand at approximately €75, €68, €62 and €57, with price currently extended above all four levels, according to TradingView data.
The 20-over-50 alignment remains intact across both the simple and exponential moving-average families, reflecting a constructive medium-term trend structure. The 14-day relative strength index sits at 66.78, an upper-neutral reading that suggests positive momentum without yet reaching technically stretched territory. The average directional index, at 48.78, indicates an established and relatively strong directional trend, lending weight to the prevailing upward move.
On the topside, the classic R1 pivot sits at €86.09; a daily close above that level would put the R2 area near €91.28 in view. To the downside, the classic pivot point at €76.16 represents initial reference support, followed by the 20-day SMA near €75. The 100-day SMA at €62.20 forms the deeper MA shelf; a sustained move below the pivot zone and 20-day SMA area would bring that longer-term level into broader focus.
The Hull moving average (9) at €80.09 registers a sell signal on TradingView's framework, sitting marginally above the last price and serving as a near-term reference level (TradingView, 2 April 2026).
This is technical analysis for informational purposes only and does not constitute financial advice or a recommendation to buy or sell any instrument.
TotalEnergies share price history (2024–2026)
TotalEnergies (TTE) is listed on Euronext Paris and has traded in New York as an ADR on the NYSE under the same ticker.
Between April 2024 and early 2025, TotalEnergies’s stock price drifted broadly lower from the mid- to upper €60s. The stock closed 2024 at €53.35 and ended 2025 at €55.49 for modest annual growth of around 4.0%, reflecting a period in which weaker oil and gas prices weighed on integrated energy valuations.
The sharpest sell-off in the two-year window came in early April 2025, when TTE dropped to a closing low of €48.36 on 9 April 2025 amid a broad risk-off move tied to US tariff announcements. The stock recovered through the remainder of 2025, closing the year up from those lows, before accelerating sharply higher in early 2026.
From a January 2026 close of €56.21, TTE climbed to an intraday peak of €81.43 on 30 March 2026, driven by rising oil prices and a wave of broker upgrades. TTE closed at €79.82 on 2 April 2026, about 42.0% up year to date and 34.4% up year on year.
Past performance is not a reliable indicator of future results. Share prices are indicative and may differ from live market prices.
TotalEnergies (TTE): Capital.com analyst view
TotalEnergies' price performance in early 2026 has been notable, with TTE climbing roughly 42% year to date as of 2 April 2026, recovering sharply from the April 2025 tariff-driven lows and benefiting from a combination of rising oil prices, broker upgrades, and the company's pivot towards LNG and upstream oil and gas following its exit from US offshore wind. The recent EDF nuclear power partnership and stronger refining margin commentary from management add further dimensions to the investment case. That said, TTE remains sensitive to oil price direction, and any easing of Middle East supply tensions, a demand slowdown, or a reversal in the broader energy sector re-rating could place downward pressure on the share price.
The company's decision to halve its buyback programme in February 2026 amid lower oil and gas prices serves as a reminder that cash returns are not guaranteed and are tied directly to commodity cycles. While TTE's diversified asset base and free cash flow projections present a constructive operational picture, currency exposure, regulatory shifts in energy transition policy, and macroeconomic uncertainty all represent headwinds that could offset near-term tailwinds.
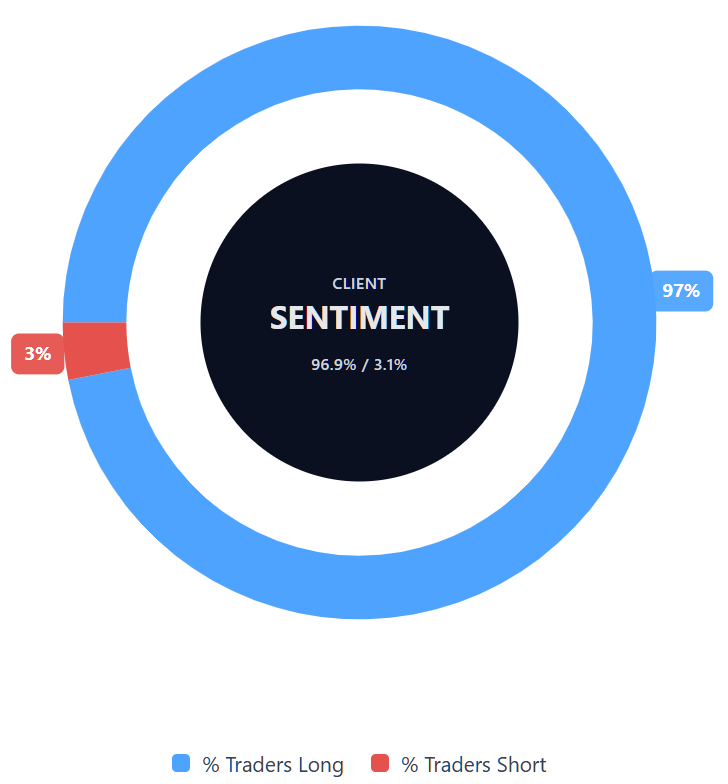
Capital.com’s client sentiment for TotalEnergies CFDs
As of 2 April 2026, Capital.com client positioning in TotalEnergies CFDs stands at 96.9% long and 3.1% short, putting buyers ahead by 93.8 percentage points and placing sentiment firmly in heavy-buy, one-sided-towards-longs territory. This snapshot reflects open positions on Capital.com at the time of writing and can change rapidly as market conditions evolve.
Summary – TotalEnergies 2026
- As of 4:19pm UTC on 2 April 2026, TTE trades at €79.65, up roughly 42% year to date and 34.4% year on year.
- Brent crude surged above $100 per barrel following President Trump's comments on the Strait of Hormuz, lifting energy sector sentiment broadly on 2 April 2026.
- TotalEnergies announced a long-term nuclear power partnership with EDF on 27 March 2026 and redirected approximately $928m from US offshore wind towards LNG and upstream oil and gas in March 2026.
- The stock went ex-dividend on 31 March 2026, with a quarterly dividend of €0.85 per share paid on 2 April 2026.
Past performance is not a reliable indicator of future results.
FAQ
Who owns the most TotalEnergies stock?
What is the 5 year TotalEnergies share price forecast?
Is TotalEnergies a good stock to buy?
Could TotalEnergies stock go up or down?
Should I invest in TotalEnergies stock?
Can I trade TotalEnergies CFDs on Capital.com?
Yes, you can trade TotalEnergies CFDs on Capital.com. Trading share CFDs lets you speculate on price movements without owning the underlying asset and to take long or short positions. However, contracts for difference (CFDs) are traded on margin, and leverage amplifies both profits and losses. You should ensure you understand how CFD trading works, assess your risk tolerance, and recognise that losses can occur quickly.