What is the triple bottom pattern and how does it work?

Learn how to identify and trade the triple bottom – a trading chart formation that signals a potential reversal from a bearish to a bullish market trend.
What is a triple bottom pattern in technical analysis?
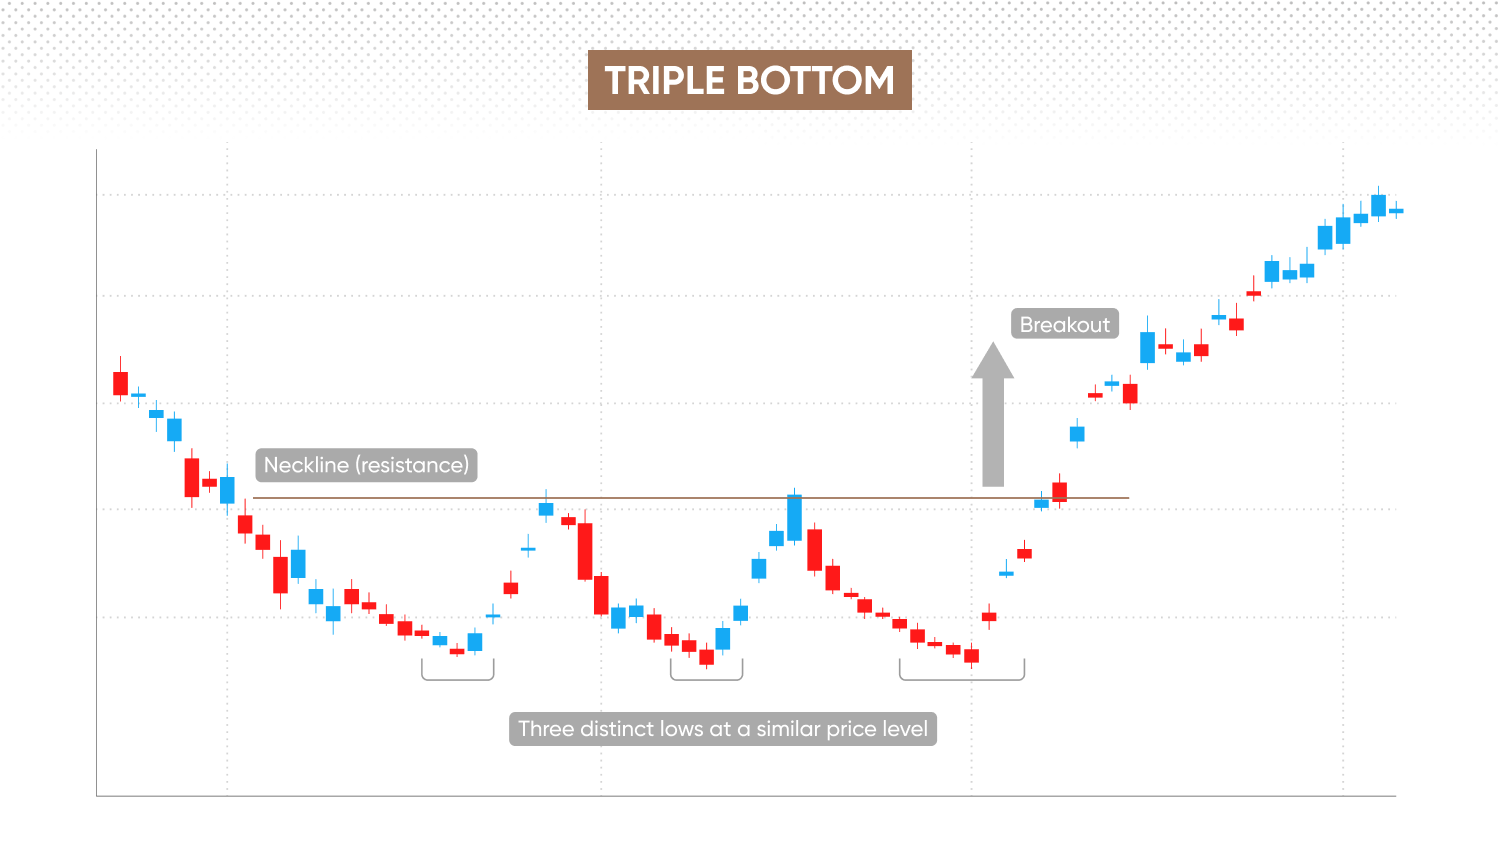
In technical analysis, a triple bottom pattern is a bullish reversal formation in technical analysis that typically appears after a downtrend. It’s characterised by three distinct lows forming near the same horizontal support level, signaling strong buying interest and price rejection at that zone.
Each dip fails to break support, and after the third low, the price begins to rise. A key confirmation occurs when the price breaks above the neckline – a resistance level drawn across the highs between the troughs. This breakout suggests a potential shift in sentiment from bearish to bullish.
How to identify a triple bottom on a chart
To identify a triple bottom chart pattern, look for these essential characteristics:
-
Confirm a clear downtrend – the triple bottom pattern emerges after an established downtrend. Ensure the price has consistently declined over an extended period, suggesting bearish market sentiment.
-
Spot three equal lows – look for three separate price lows at a similar horizontal level, forming a support. Although the lows need not be exactly identical, they should be reasonably aligned. Draw a support line to connect these lows for clarity.
-
Identify the neckline – locate the resistance line, or neckline, by connecting the highest points reached between each of the three lows. The neckline is drawn horizontally, or slightly sloped in some cases. A breakout above this line signals a potential bullish reversal.
-
Confirm the breakout – wait for a decisive breakout above the neckline (resistance). Volume may – but not always – contract as the pattern forms, suggesting bullish momentum. The breakout should ideally be accompanied by sustained closing prices above the neckline to validate the triple bottom pattern.
-
Analyse multiple timeframes – confirm the pattern's reliability by examining various timeframes. Daily or weekly charts may provide clearer signals, though patterns may also appear on shorter-term charts.
Past performance is not a reliable indicator of future results.
Learn more about support and resistance levels with our guide.
How to trade the triple bottom pattern
To trade the triple bottom pattern effectively, traders typically wait for confirmation that the pattern has completed and momentum has shifted. This involves identifying the breakout above the neckline and planning entries and risk management accordingly.
Confirm the neckline breakout
Wait for the price decisively to break above the neckline (resistance). This breakout is frequently – though not always – accompanied by above-average volume, indicating firm bullish momentum that reinforces the signal.
Entry strategy
Consider entering a long position shortly after the neckline breakout, or wait for a retest of the neckline as newly-formed support. Such a retest can provide added confirmation and help prevent false breakouts, though it may not always occur.
Setting stop-loss orders
Commonly, traders place their stop-loss* slightly below the lowest of the three bottoms. However, alternative methods – such as using an ATR-based stop or support zones – may also be considered depending on market conditions. Take recent volatility into account to minimise the risk of premature stop-outs.
Establishing take-profit targets
A typical approach is to set your profit target by measuring the vertical distance between the neckline and the triple bottom lows, then projecting this measurement upwards from the neckline breakout point to estimate a potential exit. Treat this projection as a guide only and also review nearby resistance levels when determining take-profit orders.
Enhancing your trade with technical indicators
Many traders use technical indicators such as the relative strength index (RSI) or moving average convergence divergence (MACD) to help better understand price action. When these indicators show bullish divergence – such as forming higher lows while price forms equal or lower lows – this may add to conviction in the pattern, though it does not guarantee its outcome.
Managing risk and position sizing
Ensure your position size matches your risk tolerance and available trading capital, avoiding exposure that might disproportionately impact your account. Consider using trailing stops to lock in potential gains if the market moves favourably.
*Standard stop-losses are not guaranteed, while guaranteed stop-losses – available on Capital.com – incur a fee when activated.
Can you trade the triple bottom pattern with CFDs?
Both traditional investors and contracts for difference (CFD) traders can use the triple bottom patterns, as it may signal potential upward price movements.
-
Investing involves purchasing and holding shares outright, expecting the price to rise.
-
CFDs let you speculate on both rising and falling prices, without actually owning the underlying asset.
However – because CFDs are traded on margin – leverage can magnify both potential profits and potential losses.
Explore our CFD trading vs traditional investing guide.Past performance is not a reliable indicator of future results.
Triple bottom vs double bottom pattern
Triple bottom and double bottom patterns may appear similar at first glance, but they also have some key differences – here’s how they compare:
|
Triple bottom pattern |
Double bottom pattern |
|
|
Number of lows |
Three distinct lows at a similar support level |
Two distinct lows at approximately the same support level |
|
Confirmation speed |
Slower confirmation |
Faster confirmation |
|
Trading volume |
Declining volume across lows; increase upon breakout |
Declining volume between lows; increase on breakout |
|
Market implication |
Suggests bearish exhaustion and a possible bullish reversal |
An early sign of a potential bullish reversal |
Triple bottom pattern
The triple bottom chart pattern comprises three failed attempts to push prices lower, reinforcing a similar support level. This extra test is generally viewed as strengthening the signal and underlining buyer interest. The triple bottom is considered to provide a stronger confirmation when the breakout above the neckline coincides with rising volume. However, confirmation takes longer than the double bottom.
Double bottom pattern
By contrast, the double bottom pattern forms after just two lows. Although it can still signal a bullish reversal, the smaller sample size means it is generally viewed as slightly less reliable than the triple bottom. Its principal advantage is speed: confirmation arrives sooner, giving traders the chance to capture upward momentum at an earlier stage.
Learn how to trade the double top pattern.
Triple bottom pattern example
Here is a hypothetical example of a triple bottom pattern:
Vodafone (VOD) share CFDs – triple bottom example
Suppose Vodafone share CFDs are showing repeated tests of a key support level.
After a sustained downtrend, Vodafone’s price falls from around 1.25 per share to a significant support zone near 0.98 within a month. Over the following weeks, the price revisits this support area multiple times.
On the third attempt, the price fails to break below 0.98. This repeated support holds, and bullish momentum begins to build. Soon after, Vodafone’s shares rallied above a resistance level near 1.12. Within another month, the price climbs to 1.30, further supporting the view of a bullish reversal indicated by the triple bottom structure.
Example based on hypothetical price data. This illustration is for educational purposes only and does not reflect real market activity. Past performance is not a reliable indicator of future results.
Common mistakes when trading the triple bottom pattern
Even experienced traders can mis-step trading the triple bottom pattern, causing unnecessary losses or missed opportunities. Here’s how to avoid these common mistakes:
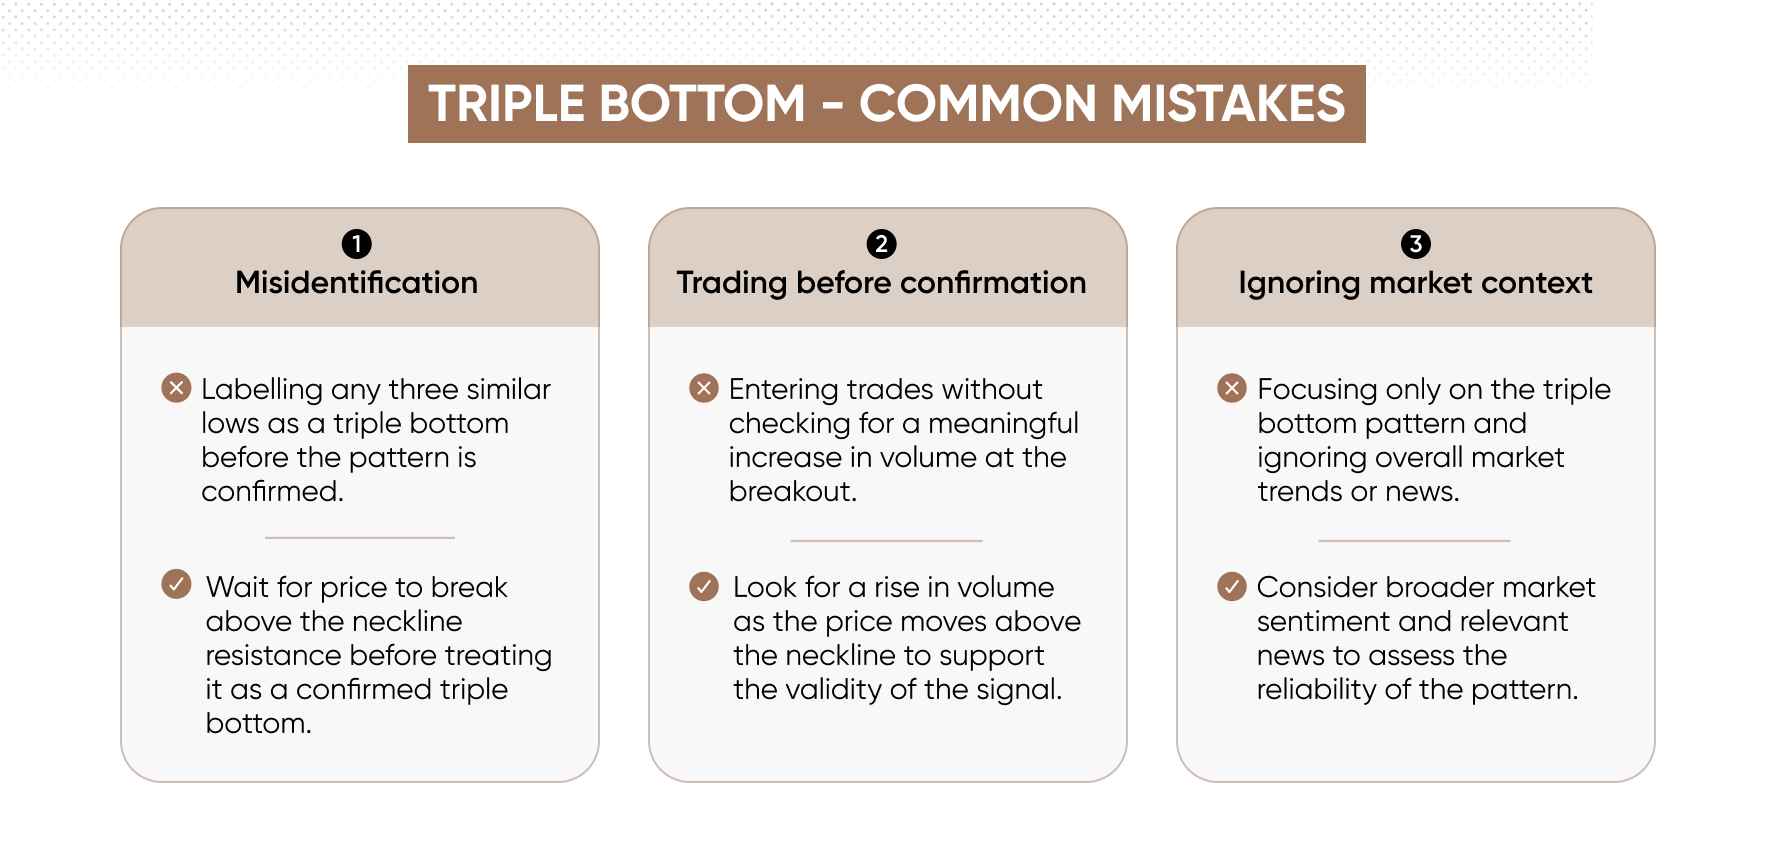
Misidentifying the triple bottom too early
One of the biggest mistakes traders make is prematurely identifying a triple bottom pattern. Not every sequence of lows near the same support level qualifies as a confirmed triple bottom. Confirmation is generally deemed more robust once price breaks above the neckline resistance, though approaches vary and breakouts are not always reliable.
Entering without volume confirmation
Volume plays a crucial role in confirming the validity of the triple bottom chart pattern. A common oversight is entering a trade without observing a meaningful volume increase at the breakout point. While a rise in volume as price breaches the neckline may support the pattern's validity, not all triple bottom breakouts are accompanied by significant volume changes. Volume analysis adds context but does not guarantee the outcome.
Ignoring broader market context
Focusing solely on the triple bottom pattern without considering wider market trends or news catalysts can also be counterproductive. Patterns do not exist in isolation – market conditions greatly influence their effectiveness. Overall market sentiment, relevant news events, and sector-specific developments can affect how triple bottom patterns unfold, as broader market factors can influence the pattern’s reliability.
FAQ
Is a triple bottom bullish?
The triple bottom pattern is commonly regarded as a bullish reversal signal within technical analysis. It is identified when buyers repeatedly intervene at a specific support level, halting further declines. Following the third low, a breakout above the neckline is often interpreted as evidence of potential bullish momentum.
What is the success rate of the triple bottom pattern?
There is no universally accepted success rate for the triple bottom pattern, as outcomes can vary depending on market conditions, asset type, and the approach used for identification. Some technical analysis research suggests favourable results in certain scenarios, but confirmation of the neckline breakout and volume considerations are used by traders to reduce the likelihood of false signals.
What is the third bottom pattern?
The 'third bottom' refers to the third price low within the triple bottom formation. This third test of support can signal persistent buyer interest and is typically viewed as the final attempt by sellers to push prices lower before a possible reversal.
Is the triple bottom pattern accurate?
No chart pattern can guarantee market direction, and the triple bottom is no exception. While some traders consider the pattern more reliable when identified and confirmed by a breakout above the neckline on increased volume, effectiveness varies depending on broader market factors. Additional technical analysis and risk management are commonly used to mitigate false signals.
What happens after a triple bottom pattern?
Following confirmation of a triple bottom pattern, some traders anticipate upward momentum, with price objectives sometimes estimated by the distance between the neckline and the pattern’s lows. However, outcomes remain uncertain, and reversals or failed breakouts are possible, making ongoing risk management essential.