Descending triangle pattern: a comprehensive guide to identification and trading
The descending triangle is generally a bearish continuation pattern, forming during a downtrend and indicating that selling pressure may persist. It illustrates an ongoing struggle between buyers and sellers, and serves as a useful tool for analysing potential price direction. This guide explains how to recognise, interpret and trade the descending triangle pattern.
Imagine two teams in a game of tug-of-war. One side starts to lose strength, while the other gradually takes control. In trading, the descending triangle pattern reflects a similar shift in momentum. It shows that buyers are weakening and sellers are becoming more dominant. As the pattern develops, price action narrows between a descending resistance line and a horizontal support level, creating a triangular shape.
What is a descending triangle pattern?
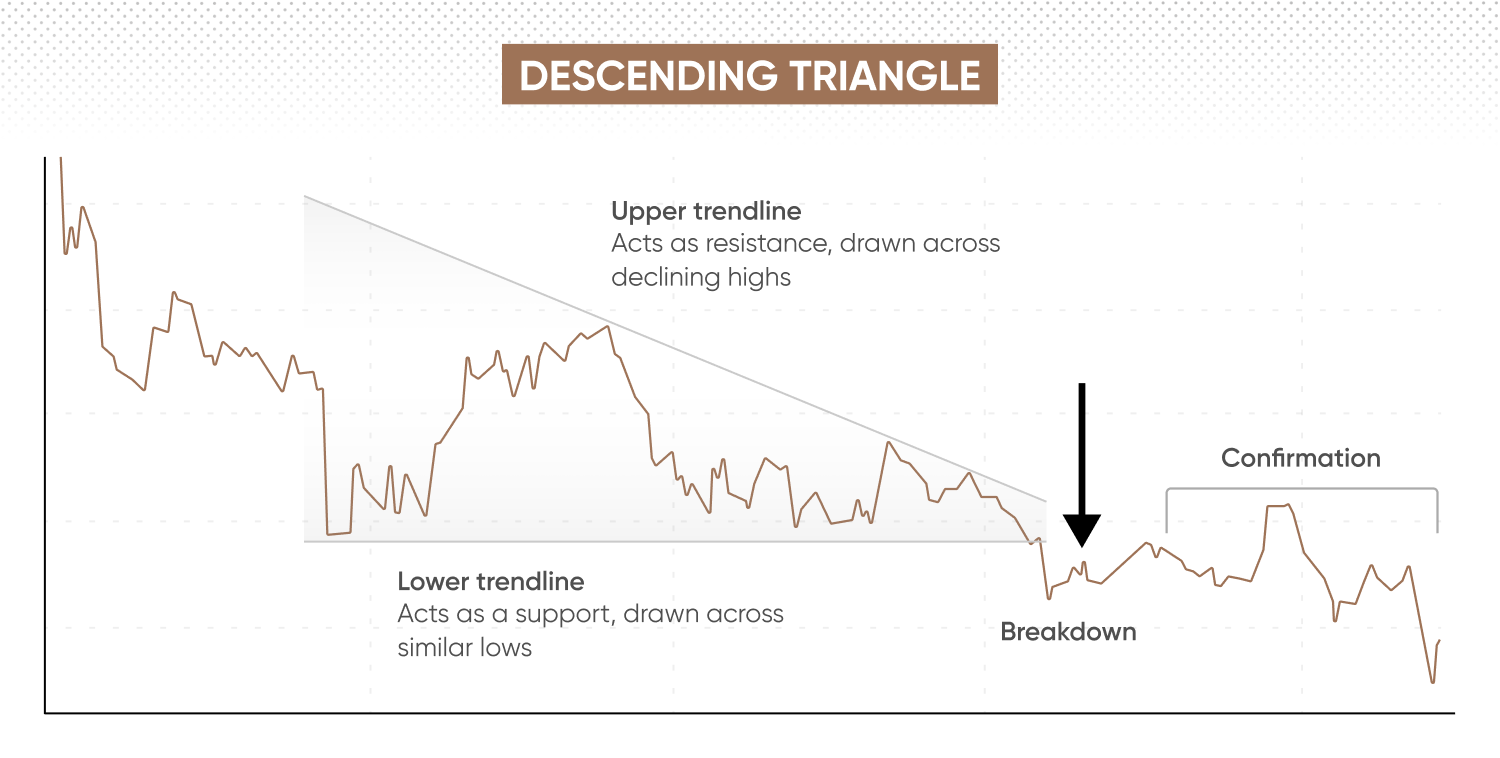
The descending triangle chart pattern typically forms during a downtrend. It consists of two converging trendlines: a horizontal support line and a downward-sloping resistance line. This pattern represents a period of consolidation, where sellers gradually gain control over buyers and push the price lower. Buyers are only able to hold their ground at a specific support level.
Past performance isn’t a reliable indicator of future results.
How to spot the descending triangle
As mentioned above, a descending triangle is defined by two distinct trendlines. The horizontal support line connects at least two swing lows around the same price level, acting as a floor where buyers step in to prevent further decline. The downward-sloping resistance line connects at least two swing highs, each lower than the last, showing that sellers are becoming more active and willing to accept lower prices.
The price typically moves between the support and resistance lines, forming a narrowing range as it approaches the apex of the triangle. This compression in price movement is one of the key characteristics of the pattern.
Symmetrical vs. descending triangle
It’s important to distinguish a descending triangle from a symmetrical triangle. A symmetrical triangle is a neutral formation with two converging trendlines – one sloping downwards and the other upwards – creating a balanced, symmetrical shape. It reflects market indecision, where neither buyers nor sellers have clear control.
In contrast, the descending triangle is generally bearish in nature, identified by its descending resistance line and steady horizontal support.
Why does the pattern form?
Chart patterns such as the descending triangle are a core element of technical analysis, based on the interaction between supply and demand.
-
The horizontal support line marks a level where buying interest temporarily absorbs selling pressure.
-
However, the downward-sloping resistance line suggests that sellers are becoming stronger.
-
As the price nears the apex, selling momentum often increases, and if demand weakens, the support line may give way, leading to a potential continuation of the downtrend.
Want to explore this pattern in real-time without using real funds? Try our free demo account.
Key features of a descending triangle
Look for specific features to distinguish a descending triangle pattern from other formations.
Lower highs, flat support
The most important feature is the combination of progressively lower highs and a horizontal support line. The lower highs indicate that each rally by buyers is weaker than the last – they fail to push the price back to previous levels. This suggests waning buying momentum.
The flat support line, often referred to as the support floor, represents the final area where buyers are holding firm. This interaction between weakening demand and consistent selling pressure results in a gradually narrowing price range.
Volume contraction
Volume typically contracts as the pattern develops. This decline in trading activity reflects reduced market participation as the price consolidates. Such periods of low volume often precede a potential breakout, which, whether upward or downward, is usually confirmed by a noticeable increase in volume.
Duration of the pattern
The descending triangle often takes several weeks or months to form, especially on longer timeframes. Patterns that form too quickly may be less reliable than those that develop gradually. A well-established structure with at least two clear touches on each trendline tends to provide a more dependable signal.
Pattern confirmation signals
A descending triangle is considered confirmed when the price closes below the horizontal support line, ideally accompanied by higher trading volume. A breakout without sufficient volume may signal a false move, so traders often look for a decisive close below support before drawing conclusions.
How often does it occur, and in which markets
Descending triangles occur across a range of markets, including shares, forex, cryptocurrencies, and commodities. They can appear on multiple timeframes – from intraday to weekly and monthly charts. However, they’re generally regarded as more reliable on higher timeframes (such as 4H or daily), where short-term volatility is reduced and the pattern is more clearly defined.
Is the descending triangle bullish or bearish?
The descending triangle is typically a bearish continuation pattern. It most often forms during a downtrend and suggests the continuation of the existing downward movement.
Why is it considered a bearish continuation?
The primary reason it’s generally viewed as bearish is the sequence of lower highs. Each upward move fails to reach the previous peak, indicating a gradual decline in buying interest and a consistent increase in selling pressure. The flat support line acts as a temporary floor, but as price action tightens, selling momentum tends to accumulate until the support level is eventually breached.
Can it be a reversal pattern?
In some instances, the descending triangle can appear as a reversal formation. This may occur towards the end of a prolonged uptrend, where it signals a potential shift in market direction. The inability to form higher highs, combined with repeated tests of the same support area, can indicate that the upward trend is losing strength. A confirmed break below support may then validate the reversal.
Impact of volume and breakout direction
The direction of the breakout is a key element in interpreting the pattern. A move below the support line accompanied by higher volume is typically seen as stronger confirmation of the bearish scenario. Conversely, a breakout that occurs without sufficient volume may indicate a false signal. An upward breakout is less frequent and may signify a failed pattern.
Case of upward breakouts
Upward breakouts occur less frequently, when buying pressure increases unexpectedly, such as following positive market developments or a shift in sentiment. In these cases, the pattern fails, and the price reverses direction, invalidating the original bearish outlook.
How to use a descending triangle pattern
The descending triangle is generally most effective on higher timeframes, such as the 1-hour, 4-hour, or daily charts. Patterns that form on these intervals are less affected by short-term noise and tend to produce clearer signals. While the pattern may also appear on shorter timeframes (for example, the 5-minute chart), it is often considered less dependable.
Confirming with indicators
Some of the common technical indicators used to confirm the descending triangle pattern include the following:
Moving average convergence divergence (MACD)
Look for the MACD line crossing below the signal line, which may suggest that bearish momentum is developing as the pattern progresses. A crossover below the signal line or a declining histogram can indicate weakening upward momentum.
Relative strength index (RSI)
A falling RSI that moves below the 50 level during the formation of the pattern may support the bearish outlook. A breakout that pushes the RSI towards oversold territory (below 30) can indicate strong downward momentum, although it’s important to note that extreme readings can sometimes precede short-term reversals.
Moving averages (MAs)
A moving average, such as the 50-period or 200-period MA, can act as dynamic support or resistance. During the formation of a descending triangle, price action often consolidates below a key moving average. A breakout below both the horizontal support line and the moving average can strengthen confirmation of the pattern.
Learn more about technical analysis and chart patterns before applying the descending triangle in practice.
How to trade the descending triangle
You need a clear and structured approach, including defined entry, stop-loss, and take-profit levels.
Entry points
Entry methods typically include a breakout entry, retest entry, or early entry near resistance.
An early entry involves taking a short position close to the descending resistance line before the breakout. This is a higher-risk method, as a failed pattern could result in a quick reversal.
The most common approach is to enter when the price closes decisively below the horizontal support line, confirming the pattern’s formation.
A more conservative strategy is to wait for the price to break support, move lower, and then retest the broken level from below. The former support now acts as resistance, and a rejection at this level may offer a higher-probability setup.
Stop-loss and take-profit orders
A typical stop-loss order can be placed just above the most recent swing high within the triangle or above the descending resistance line. This helps limit exposure if the breakout fails.*
The take-profit target is usually calculated by measuring the height of the triangle at its widest point (the start of the formation) and projecting that distance from the breakout point.
*Standard stop-loss orders are not guaranteed. Guaranteed stop-loss orders incur a fee if activated.
Price target projection
Measure the vertical distance from the highest point of the pattern to the horizontal support line. This measurement gives the projected target.
For example, if the height of the triangle is £5 and the breakout occurs at £50, the target would be £45.
Volume confirmation
It’s important to confirm the breakout with an increase in trading volume. A breakout without higher volume may indicate a false signal.
An increase in volume suggests that more market participants are trading in the direction of the breakout, providing additional momentum for the move.
Descending triangle trading strategies
Combining the descending triangle with other technical methods can help strengthen confirmation of the pattern.
Descending triangle breakout strategy
Use moving averages (MAs) to help confirm the prevailing trend and breakout. If the price remains consistently below the 50-period or 200-period MA, it indicates a sustained bearish bias. A breakout from the triangle that also moves below a key MA can serve as additional confirmation of downward momentum.
Descending triangle with moving averages
Moving averages can be used to support the analysis of the descending triangle. If the price is trading beneath the 50-period or 200-period MA, it reinforces the bearish trend. A breakout that coincides with a move below a significant MA provides stronger validation of the pattern.
Descending triangle + Heikin-Ashi confirmation
Heikin-Ashi charts can help reduce market noise and provide smoother visual signals. When a descending triangle forms, look for a series of red Heikin-Ashi candles with minimal or no upper wicks. A breakout accompanied by a long red Heikin-Ashi candle without an upper wick may confirm clear downward momentum.
Learn more about CFD trading strategies and how they can be applied across different timeframes.
Descending triangle vs. similar patterns
It is important to distinguish the descending triangle from other chart patterns to reduce the risk of misinterpretation.
Falling wedge
The falling wedge is generally a bullish continuation or reversal pattern, making it the opposite of the descending triangle. It consists of two downward-sloping trendlines, with the price forming lower highs and lower lows. As the lines converge, a breakout to the upside is often anticipated.
The key distinction lies in the angle of the support line. A descending triangle has a flat horizontal support level, while a falling wedge features a downward-sloping support line.
Ascending triangle
The ascending triangle is typically a bullish continuation pattern. It has a flat resistance line and an upward-sloping support line. This pattern is the inverse of the descending triangle, and it often signals a potential upward breakout.
Symmetrical triangle
The symmetrical triangle is a neutral formation consisting of two converging trendlines – one sloping downward and the other upward. It reflects market indecision and can break in either direction, making it generally less directional than the descending triangle.
|
Pattern |
Support |
Resistance |
Bias |
Typical breakout |
|
Descending triangle |
Flat, horizontal |
Sloping downward |
Bearish |
Downward |
|
Falling wedge |
Sloping downward |
Sloping downward |
Bullish |
Upward |
|
Ascending triangle |
Sloping upward |
Flat, horizontal |
Bullish |
Upward |
|
Symmetrical triangle |
Sloping upward |
Sloping downward |
Neutral |
Either direction |
Pros and cons of the descending triangle pattern
Potential advantages of this pattern include its clear structure and defined entry and exit points. Its typically bearish bias makes the likely breakout direction easier to anticipate. It’s also relatively simple to identify, with its flat horizontal support and downward-sloping resistance lines easy to recognise on a chart. The pattern is often observed in trending markets.
However, the descending triangle also has its limitations, such as the potential for a false breakout, where the price briefly moves below support before reversing. This can invalidate the setup. The pattern is also not fully reliable in isolation and should ideally be confirmed by volume, supporting indicators, and a clear breakout. In a sideways or choppy market, it may be less effective and fail to generate a meaningful move.
Incorporating sound risk management techniques is essential before applying any pattern analysis in live trading conditions.
Real market examples
In the stock market, a descending triangle can sometimes appear during consolidation following a decline. For example, after a disappointing earnings release, a share price may fall and then form a descending triangle as sellers continue to apply pressure while buyers defend a key support level. A break below this structure could indicate continued weakness in the market.
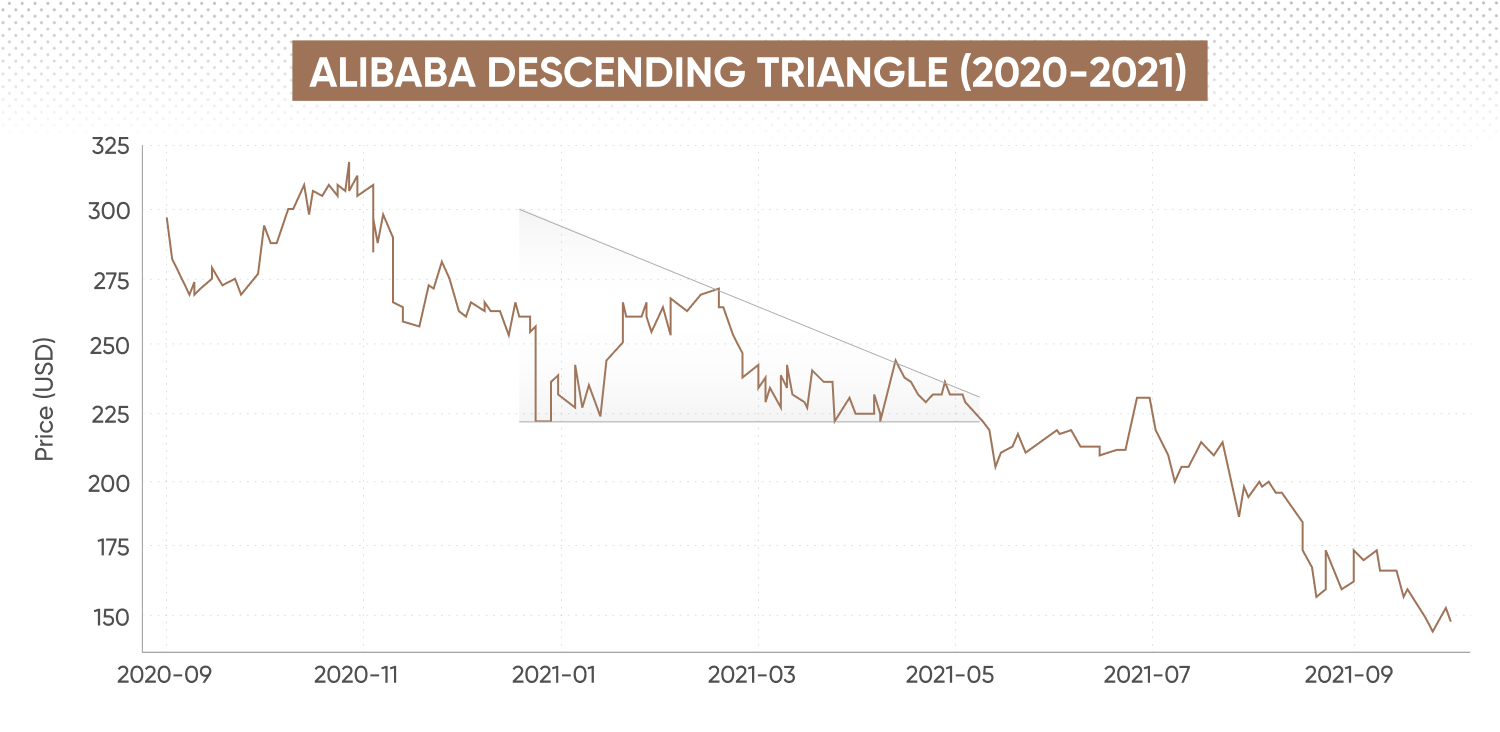
Past performance isn’t a reliable indicator of future results.
In the crypto market, where volatility and strong trends are common, descending triangles can form after sharp downward moves. The pattern often represents a pause in selling momentum, as the market consolidates before another move lower. A breakout from the triangle is typically accompanied by higher trading volume.
In the forex market, a pair such as EUR/USD might display a descending triangle during a period of economic or policy uncertainty. For instance, if the European Central Bank (ECB) announces a policy that weighs on the euro, the pair may consolidate within a descending triangle as participants assess sentiment. A confirmed breakout could then reflect a continuation of the prevailing downtrend.
Common mistakes and how to avoid them
One of the most frequent errors is mistaking the descending triangle for the falling wedge. A descending triangle features a flat horizontal support line, whereas a falling wedge has a downward-sloping support line. Confusing the two can lead to misinterpreting a potential bullish formation as bearish.
Patience is essential. Entering a trade before a clear, confirmed breakout can lead to unreliable results. It’s generally better to wait for a decisive close below the support line, ideally supported by higher trading volume.
A breakout without a corresponding increase in volume may indicate a false signal. This can catch traders off guard if not verified by other factors. Relying on a single chart pattern alone can also be misleading. It’s advisable to use supporting indicators or apply a multi-timeframe analysis to validate the setup.
Consider practising with a demo account before applying any chart pattern analysis in live market conditions.
FAQs
What is a descending triangle pattern in trading?
A descending triangle is a technical chart formation that appears when a horizontal support line meets a downward-sloping resistance line. It typically develops during a downtrend and reflects a period of consolidation, where sellers gradually gain strength while buyers defend a key price level. The pattern may indicate the continuation of the existing trend once support is breached.
How can I identify a descending triangle on a chart?
To identify a descending triangle, look for two clear trendlines: a flat support line connecting at least two similar lows, and a descending resistance line linking progressively lower highs. The price generally narrows towards the apex as buying pressure weakens and selling pressure increases.
Is the descending triangle pattern always bearish?
The descending triangle is most often associated with bearish continuation, especially when it forms during a downtrend. However, it can occasionally act as a reversal formation at the end of an uptrend. In such instances, confirmation through volume and supporting indicators is recommended before making any assumption about direction.
Which indicators can confirm a descending triangle pattern?
Commonly used tools include the moving average convergence divergence (MACD), relative strength index (RSI) and moving averages (MAs). For example, falling RSI readings or MACD crossovers below the signal line can indicate weakening momentum. A rise in trading volume during a breakout can also add further confirmation of the move.
What are the common mistakes when trading a descending triangle?
Frequent errors include entering before confirmation, confusing it with similar patterns such as the falling wedge, or overlooking volume signals. A breakout without an accompanying increase in volume may indicate a false move. It’s also important not to rely solely on one pattern – combining it with other indicators and timeframes can provide stronger analytical context.