Stellantis stock forecast: EU30 registrations, Leapmotor talks
Stellantis is a global carmaker listed in Milan, with current attention on stronger Q1 2026 EU30 registrations, reported Leapmotor talks, and governance changes due at its 14 April AGM. Past performance is not a reliable indicator of future results. Explore third-party STLAM price targets.Stellantis N.V. (STLAM) is trading at €6.90 as of 12:33pm UTC on 10 April 2026, near the top of the session's €6.53–€6.91 intraday range, according to Capital.com's quote feed. Past performance is not a reliable indicator of future results.
Price action comes amid several converging drivers. Stellantis reported a 5% year-on-year increase in EU30 vehicle registrations for Q1 2026, with market share rising to 17.5% – its highest quarterly reading since Q1 2024 – as FIAT (+25.4%) and Lancia (+15.7%) led brand performance (Stellantis Media, 9 April 2026). Separately, Reuters reported on 8 April 2026 that the company is in advanced talks with Leapmotor to jointly develop an Opel-branded electric SUV, adding a product-pipeline dimension to investor focus (Reuters, 8 April 2026). Attention is also turning to the AGM scheduled for 14 April 2026 in Amsterdam, where governance changes, including the conclusion of John Elkann's term as an executive director, are on the agenda (Stellantis.com, 10 April 2026), alongside the broader sector overhang of the 15% US tariff on EU auto imports confirmed in September 2025 (Reuters, 25 September 2025).
Stellantis stock forecast 2026–2030: Third-party price targets
As of 10 April 2026, third-party Stellantis stock predictions reflect a consistently cautious consensus, shaped by the group's €22.2 billion H2 2025 charges, a guidance range of negative adjusted free cash flow for full-year 2026, and ongoing tariff headwinds in key markets.
Morgan Stanley (house view, Equal Weight)
Morgan Stanley analyst Javier Martinez de Olcoz Cerdan trims its STLAM stock forecast to €6.50 from €7 while keeping an Equal Weight rating. The revision follows a further reassessment of margin recovery assumptions amid persistent operating headwinds in both North American and European segments (TipRanks, 30 March 2026).
Citi (house view, Neutral)
Citi analyst Harald Hendrikse maintains a Neutral rating and holds a price target of €7, with the stock placed on the firm's upside 90-day catalyst watch. Hendrikse flags concern over profitability in both the US and European markets, noting that a roughly 39% year-to-date decline in the stock may prompt a shift in investor sentiment (Yahoo Finance, 1 April 2026).
Public.com (multi-broker consensus)
Public.com aggregates five analyst ratings on NYSE-listed STLA, producing a Buy consensus rating, with 20% Strong Buy, 20% Buy, and 60% Hold. The service records a consensus 12-month price target of $11.59 across those analysts, noting that ratings and forecasts are subject to frequent revision as the turnaround timeline becomes clearer (Public.com, 30 March 2026).
MarketScreener (multi-broker consensus)
MarketScreener tracks a broad panel of analysts covering STLAM, with the consensus mean target sitting at approximately €8.28 across the panel, within a range spanning a low near €5 and a high near €16. The prevailing rating is Outperform by count, though the cluster of Hold ratings from major houses tempers that reading, amid the group's ongoing restructuring execution risk and guidance for negative free cash flow in 2026 (MarketScreener, 30 March 2026).
Predictions and third-party forecasts are inherently uncertain, as they cannot fully account for unexpected market developments. Past performance is not a reliable indicator of future results.
STLAM stock price: Technical overview
The STLAM stock price trades at €6.90 as of 12:33pm UTC on 10 April 2026, holding near the top of the session's €6.53–€6.91 intraday range. Price sits above the short-and medium-term moving-average cluster – the 20/50-day SMAs at approximately €6.05 and €6.50 – sustaining a 20-over-50 alignment, per TradingView data. The 100- and 200-day SMAs, at €7.84 and €8.15 respectively, remain overhead and continue to register sell signals on the same dataset.
Momentum signals are mixed. The 14-day RSI reads 63.2, placing it in the upper-neutral zone, while the ADX at 25.1 indicates a trend of moderate-to-established strength, according to TradingView. The MACD (12, 26) level at 0.060 registers a buy signal on the same source.
On the classic pivot framework from TradingView, the nearest resistance reference is R1 at €6.73; a daily close above that level would put R2 near €7.39 in view. To the downside, the classic pivot at €6.02 represents initial support. This is followed by S1 at €5.35 if the pivot gives way, while the 100-day SMA at €7.84 remains a longer-term recovery reference (TradingView, 10 April 2026).
This is technical analysis for informational purposes only and does not constitute financial advice or a recommendation to buy or sell any instrument.
Stellantis share price history (2024–2026)
STLAM’s stock price closed at €25.23 on 11 April 2024, near the top of the two-year window, before beginning a protracted decline that left the stock at €6.90 as of 10 April 2026.
From those April 2024 highs, STLAM shed ground steadily through H2 2024, closing the year on 30 December 2024 at €12.60. Early 2025 brought brief stabilisation around the €13.50 area in February, but the stock slipped back into single digits by late March 2025, closing at €9.44 on 3 April 2025 as trade tariff concerns weighed on the European auto sector. A partial recovery into autumn 2025 lifted STLAM back towards €10.50 on 5 December 2025, before a renewed slide into the new year.
The sharpest single-session move in the period came on 6 February 2026, when the stock dropped roughly 24.1% to €6.23 after Stellantis flagged a €22.2 billion write-down alongside negative free cash flow guidance for the full year. STLAM opened 2026 at €9.71 on 2 January, and at €6.90 on 10 April 2026 the stock is approximately 28.9% down year to date and 14.1% lower year on year.
Past performance is not a reliable indicator of future results. Share prices are indicative and may differ from live market prices.
Stellantis (STLAM): Capital.com analyst view
Stellantis (STLAM) has endured one of the most challenging stretches in its short listed history over the past two years, with the share price falling from above €25 in April 2024 to €6.90 as of 10 April 2026. The February 2026 write-down announcement, combined with guidance for negative free cash flow through the full year, crystallised investor concerns that had been building since mid-2024. For some market participants, the severity of the decline may reflect a valuation reset that prices in much of the restructuring pain; for others, the absence of a clear earnings recovery timeline and the persistent overhang of US auto tariffs may be reasons to remain cautious.
Looking at nearer-term drivers, the reported 5% rise in Q1 2026 EU30 registrations and the advanced talks to develop an Opel electric vehicle in partnership with Leapmotor may offer positive signals for the operational turnaround. However, the group's upcoming AGM on 14 April 2026 brings governance changes that could introduce further uncertainty, and any deterioration in the macro backdrop or escalation of trade tariffs could weigh on a recovery that is still at an early stage.
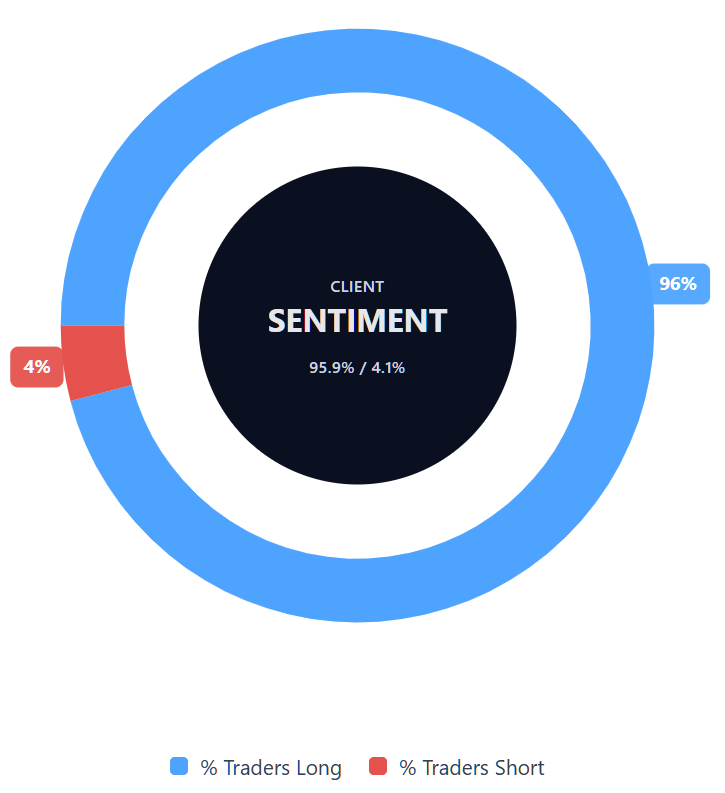
Capital.com’s client sentiment for Stellantis CFDs
As of 10 April 2026, Capital.com client positioning in Stellantis CFDs stands at 95.9% buyers vs 4.1% sellers, putting buyers ahead by 91.8 percentage points and placing sentiment firmly in heavy-buy, one-sided-towards-longs territory. This snapshot reflects open positions on Capital.com and can change rapidly as market conditions evolve.
Summary – Stellantis 2026
- Stellantis (STLAM) trades at €6.90 as of 12:33pm UTC on 10 April 2026, down 28.9% year to date and 14.1% year on year.
- Key price drivers include the group's negative free cash flow guidance for 2026, ongoing US auto tariff exposure, and credit rating downgrades by Moody's and S&P.
- On the positive side, Q1 2026 EU30 registrations rose 5% year on year, with STLAM's market share reaching 17.5% – its highest since Q1 2024.
- Reuters reported on 8 April 2026 that Stellantis is in advanced talks with Leapmotor to co-develop an Opel electric SUV, adding an EV pipeline catalyst.
- The AGM scheduled for 14 April 2026 brings governance changes, including the conclusion of John Elkann's term as executive director, keeping corporate developments in focus.
Past performance is not a reliable indicator of future results.
FAQ
Who owns the most Stellantis stock?
What is the 5 year Stellantis share price forecast?
Is Stellantis a good stock to buy?
Could Stellantis stock go up or down?
Should I invest in Stellantis stock?
Can I trade Stellantis CFDs on Capital.com?
Yes, you can trade Stellantis CFDs on Capital.com. Trading share CFDs lets you speculate on price movements without owning the underlying asset and to take long or short positions. However, contracts for difference (CFDs) are traded on margin, and leverage amplifies both profits and losses. You should ensure you understand how CFD trading works, assess your risk tolerance, and recognise that losses can occur quickly.