Intesa Sanpaolo stock forecast: Q1 results and share plan
Intesa Sanpaolo is an Italian banking group listed on the Borsa Italiana, with attention now on its Q1 2026 results and an April 2026 capital increase linked to its share plan. Explore third-party ISP price targets and technicals. Past performance is not a reliable indicator of future results.
Intesa Sanpaolo S.p.A. (ISP) last closed at €5.69 on 27 April 2026, with the intraday session ranging between €5.57 and €5.69 on Capital.com's quote feed as of 12:02pm UTC. Past performance is not a reliable indicator of future results.
Sentiment across Italian financial stocks has been broadly firmer during the session, with sector peers including UniCredit and Banco BPM also edging higher on the IT40, even as the Italian benchmark index slipped 0.1% and remained on course for its weakest month since June 2022 (Trading Economics, 31 March 2026). Attention is also focused on the upcoming ECB policy meeting on 30 April 2026, at which rates are widely expected to hold at 2% following the March decision to keep the deposit facility rate unchanged (Bloomberg, 15 April 2026). A steady rate backdrop continues to support Italian bank net interest margins (Financial Times, 25 February 2026). Meanwhile, Intesa Sanpaolo's Q1 2026 earnings release is scheduled for 5 May 2026 (MarketScreener, 25 February 2026), and on 14 April 2026 the bank filed notice of a capital increase without payment related to its 2022–2025 Performance Share Plan long-term incentive scheme, partially exercising powers granted at its 2022 Extraordinary Shareholders' Meeting (Intesa Sanpaolo, 14 April 2026).
Intesa Sanpaolo outlook: Q1 results near, targets in focus
As of 27 April 2026, third-party Intesa Sanpaolo stock predictions reflect 12-month price targets shaped by the bank's 2026–2029 capital return plan, the ECB's rate path, and the stock's correction from its February 2026 peak near €6.10.
MarketScreener (21-analyst consensus, 19 April 2026)
MarketScreener tracks 21 analysts covering ISP and records a mean Buy consensus as of 19 April 2026, with an average 12-month price target of €6.63, a high estimate of €7.40, and a low of €5. The spread across individual estimates reflects differing assumptions about the sustainability of net interest income as the ECB continues its rate normalisation path (MarketScreener, 19 April 2026).
Simply Wall St (fair value assessment, 22 April 2026)
Simply Wall St places ISP's analyst-derived fair value at approximately €6.61, against a last close of €5.68 recorded at the time of publication on 23 April 2026. The analysis notes that the valuation gap rests on the bank's future earnings power, with the discount to fair value widening following the stock's pullback from its early-2026 highs (Simply Wall St, 23 April 2026).
Predictions and third-party forecasts are inherently uncertain, as they cannot fully account for unexpected market developments. Past performance is not a reliable indicator of future results.
ISP stock price: Technical overview
The ISP stock price trades at €5.69 on the daily chart as of 27 April 2026, with the 10-day SMA at €5.76 and the 10-day EMA at €5.69 both sitting just above the last close and registering sell signals. By contrast, the broader moving-average stack remains constructive: the 20/50/100/200-day SMAs sit at approximately €5.58 / €5.49 / €5.67 / €5.55, with most still returning buy signals per TradingView data.
The 14-day RSI reads 55.7, placing momentum in the upper-neutral zone, with no strong directional impulse confirmed. The ADX(14) at 24.9 is just below the 25 threshold associated with an established trend, suggesting the current move lacks a firmly entrenched directional bias, per TradingView oscillator data.
On the topside, the classic R1 pivot at €5.62 is the nearest reference above the last close; a daily close above that level would put the R2 area near €6.07 into broader focus. To the downside, the classic pivot point at €5.22 represents initial support, with the 100-day SMA near €5.67 and the 200-day SMA near €5.55 forming a nearby moving-average shelf. A sustained move beneath S1 at €4.76 would mark a more material deterioration in the near-term structure (TradingView, 27 April 2026).
This is technical analysis for informational purposes only and does not constitute financial advice or a recommendation to buy or sell any instrument.
Intesa Sanpaolo share price history (2024–2026)
ISP’s stock price closed at €3.55 on 29 April 2024, then moved steadily higher through the year, ending 2024 at €3.87 – a gain of roughly 47% over the full calendar year, as European bank stocks broadly benefited from sustained net interest income in a higher-for-longer rate environment.
The rally extended sharply into 2025. ISP broke above €4 in March 2025, cleared €5 in June, and pushed above €5.90 through November and December. A brief but severe sell-off hit on 7 April 2025, when the stock dipped to an intraday low of €3.69 amid global tariff-shock volatility, before recovering quickly. By year-end 2025, ISP closed near €5.95, representing a gain of roughly 81% across 2025 as the bank posted record earnings and announced a €2.3bn share buyback.
2026 began with the stock trading above €6, briefly touching a session high of €6.17 on 4 February 2026 – its strongest level in the dataset. A broad pullback followed through March, with ISP sliding towards €5.10, coinciding with renewed macro uncertainty and a tariff-driven European equity retreat. The stock has since partially recovered, closing at €5.71 on 27 April 2026, approximately 4.3% down year to date from the 2 January 2026 close of €5.95.
Past performance is not a reliable indicator of future results. Share prices are indicative and may differ from live market prices.
Intesa Sanpaolo (ISP): Capital.com analyst view
Intesa Sanpaolo's price performance over the past two years reflects a sustained re-rating of the European banking sector, with ISP climbing from around €3.55 in late April 2024 to a high near €6.17 in early February 2026, driven by a combination of robust net interest income, record 2025 earnings, and the bank's well-received 2026–2029 capital return plan. That said, the stock's subsequent retreat towards the mid-€5 range through March and April 2026 illustrates that a supportive earnings backdrop does not insulate the share price from macro headwinds. Renewed trade uncertainty and a volatile ECB rate outlook have weighed on the sector, and any further deterioration in the European growth outlook could put additional pressure on net interest margins and credit quality.
Looking ahead, the structural case for ISP centres on capital distribution capacity and earnings resilience, with analysts broadly maintaining Buy ratings and consensus 12-month targets well above the current price. However, the gap between the current price and those targets does not guarantee convergence. Bank valuations remain sensitive to rate expectations, regulatory capital requirements, and geopolitical developments, all of which can shift quickly in either direction.
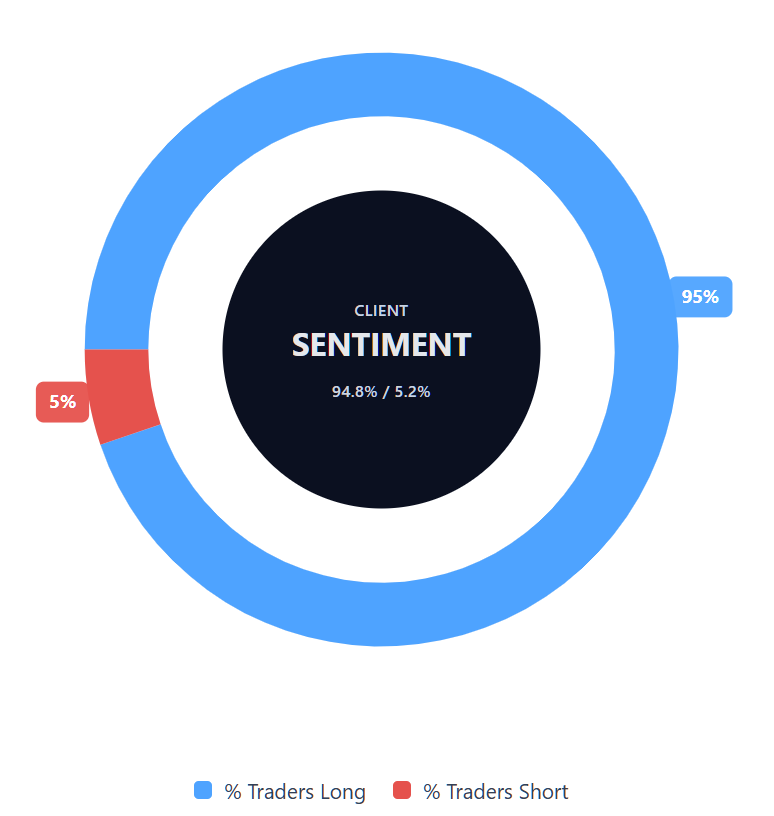
Capital.com’s client sentiment for Intesa Sanpaolo CFDs
As of 27 April 2026, Capital.com client positioning in Intesa Sanpaolo CFDs shows 94.8% buyers and 5.2% sellers. That puts buyers ahead by 89.6 percentage points and leaves sentiment in a strongly one-sided, long-heavy position. This snapshot reflects open positions on Capital.com at the time of capture and can change rapidly as market conditions evolve.
Summary – Intesa Sanpaolo 2026
- ISP climbed roughly 81% across 2025, supported by record full-year net income of €9.3bn and a €2.3bn buyback; a sharp tariff-driven sell-off in early April 2025 briefly pulled the stock to €3.69 before it recovered.
- Key price drivers include the ECB's rate path, as steady or falling rates could compress net interest margins, while the bank's guidance for around €10bn net income in 2026 underpins the bullish case.
- Intesa Sanpaolo's Shareholders' Meeting is scheduled for 30 April 2026, with Q1 2026 results due on 5 May 2026; the bank also filed notice in April 2026 of a capital increase linked to its 2022–2025 Performance Share Plan.
Past performance is not a reliable indicator of future results.
FAQ
Who owns the most Intesa Sanpaolo stock?
Intesa Sanpaolo’s shareholder base is spread across institutional and strategic investors, and the largest holders can change over time as positions are adjusted. In practice, ownership data is usually tracked through regulatory filings and shareholder disclosures rather than day-to-day market commentary. For readers of this article, the more relevant point is that changes in major holdings can affect sentiment and liquidity, but they do not by themselves determine the stock’s future direction.
What is the five-year Intesa Sanpaolo share price forecast?
Is Intesa Sanpaolo a good stock to buy?
Could Intesa Sanpaolo stock go up or down?
Should I invest in Intesa Sanpaolo stock?
Can I trade Intesa Sanpaolo CFDs on Capital.com?
Yes, you can trade Intesa Sanpaolo CFDs on Capital.com. Trading share CFDs lets you speculate on price movements without owning the underlying asset and to take long or short positions. However, contracts for difference (CFDs) are traded on margin, and leverage amplifies both profits and losses. You should ensure you understand how CFD trading works, assess your risk tolerance, and recognise that losses can occur quickly.