Three outside up candlestick pattern: how to identify and trade it

Remember, as with all technical analysis, while these patterns may give clues on potential future price action, past performance is not a reliable indicator of future results.
Ready to discover how to trade the 3 outside up pattern? Read on.
What is the 3 outside up candlestick pattern?
The 3 outside up is a bullish reversal pattern. It is a 3 candlestick pattern that appears after a downtrend. It signals a potential shift in momentum. The pattern suggests that the selling pressure is over and that buying pressure is taking over. This pattern is a potentially more reliable version of the bullish engulfing candlestick pattern. It uses a third candle for confirmation. This extra confirmation is important, since it gives traders more confidence. It shows that a major shift in market sentiment is happening. Traders often look for this pattern at key support levels. This makes the signal even more powerful.
How the 3 outside up pattern forms
The 3 outside up candlestick pattern occurs in a specific sequence, with each candle playing a key role to complete the formation.
First candle
This is a small, bearish candle. It is the last candle of the downtrend. This candle shows that the selling pressure is weakening. It signals that the downtrend is losing steam.
Second candle
This is a large, bullish candle that engulfs the first candle. This means its body is larger than that of the first candle. It also means that its body fully contains the first candle’s body. This candle shows a major shift in power. Buyers have overwhelmed sellers and reversed the direction of the price movement.
Third candle
This is another bullish candle. It confirms the new upward trend. It must close higher than the second candle’s close. This shows a continuation of the bullish momentum.
The formation of the third candle is crucial, since it validates the reversal. Without the third candle, the pattern is just a simple bullish engulfing pattern.
 Past performance is not a reliable indicator of future results.
Want to try recognising this 3 candlestick pattern on a real price chart without risking real money? Open a demo account.
Psychology behind the pattern
The 3 outside up candlestick pattern tells a story of a market battle.
The first candle represents the last attempt of the bears to stay in control, signalling a bearish sentiment reversal. Although they are still in control, their power is weakening. The small body of the candle shows indecision.
The second candle marks a major change of a bullish takeover. It starts low, but buyers rush in and push the price far above the previous close. They swallow the entire range of the first candle. This is a clear warning to the bears.
The third candle is the confirmation. Bulls continue to push the price higher, establishing their dominance. It shows the new trend is likely to continue. It gives traders confidence to enter a long position. The increase in volume on the second and third candles adds more strength to this story. It shows that many traders are joining the new bullish trend.
How to identify the pattern on charts
If you want to know how to trade the 3 outside up pattern, you first need to learn how to identify it correctly. Here’s what to look for:
First candle: look for a bearish candle with a short body. It is part of a clear downtrend.
Second candle: check if the next candle is a large bullish one. Its body must fully contain the body of the first candle.
Third candle: the final candle must also be bullish. It must close higher than the second candle’s close.
This pattern is best identified on daily or 4-hour charts. These timeframes reduce noise. The pattern is also most reliable when it forms after a clear downtrend. It is a reversal pattern that indicates a change in the trend to the upside. It is not effective in a sideways or non-trending market.
Trading strategy based on the 3 outside up pattern
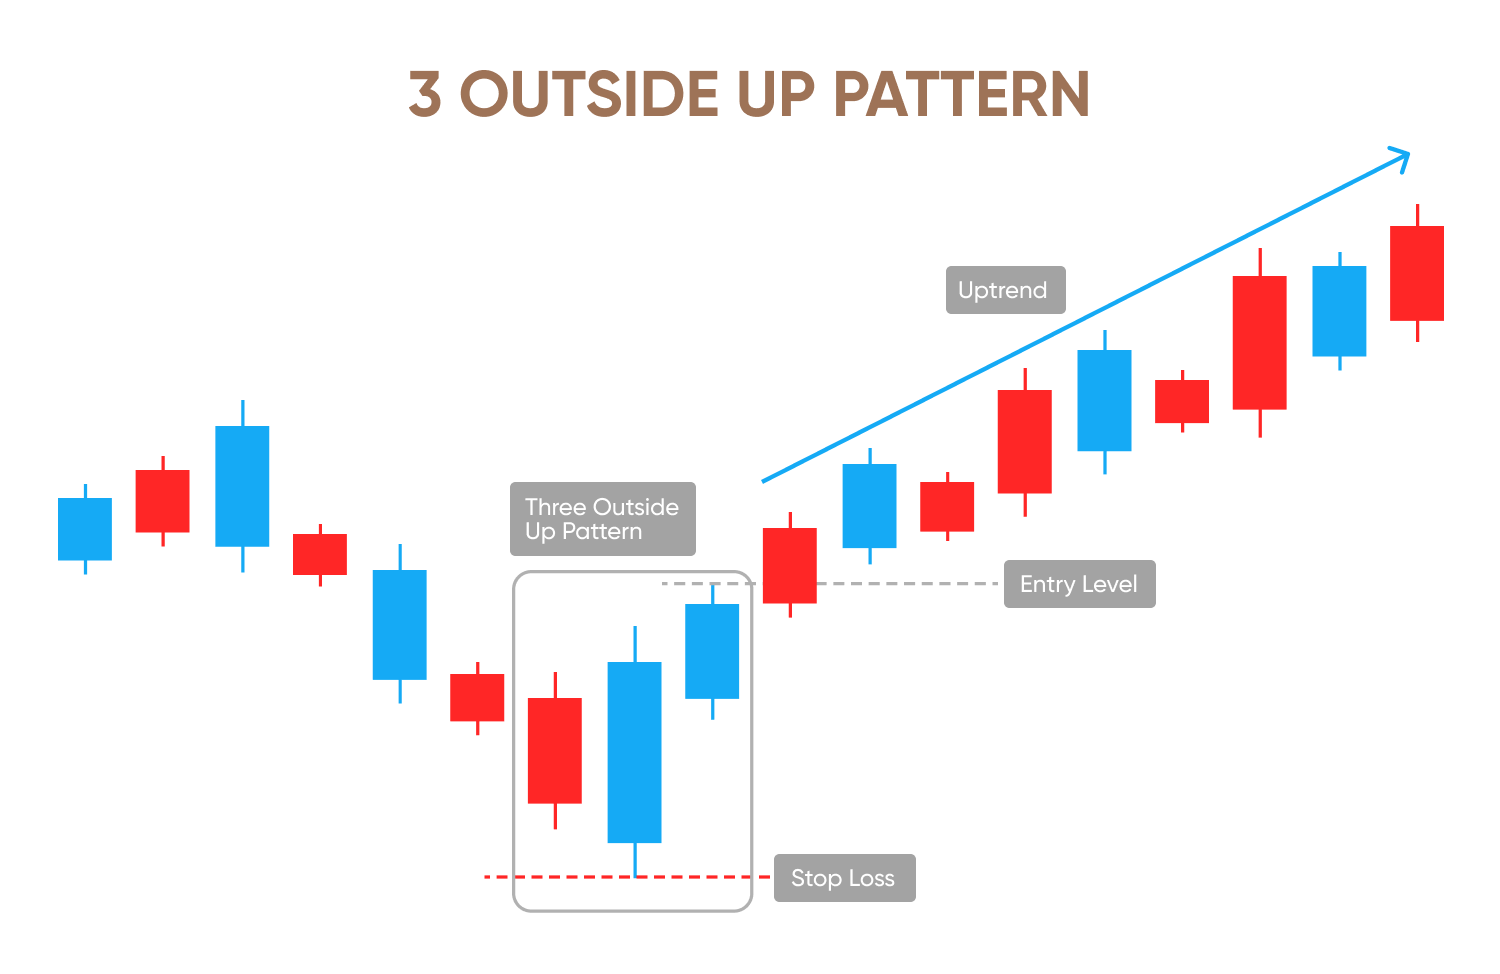
Once you identify the pattern, you can plan a trade. Use the candles to set your entry and exit points.
Entry point: after the close of the third candle
Enter a trade after the third candle closes. This confirms that the pattern is complete. Entering earlier is risky. Waiting for the third candle confirms the bullish trend reversal.
Stop-loss placement: below the low of the pattern
Set your stop-loss below the low of the pattern. This is usually the low of the second candle. Placing the stop-loss here limits losses if the price moves unfavourably. If the price falls below this point, the pattern has likely failed.
Take-profit levels: previous resistance, risk-reward targets
You can set profit targets in a few ways. One way is to target a previous resistance level. The price might struggle at this level. Another way is to use a risk-reward ratio. A popular ratio is 1:2 or 1:3. This means you aim to make 2 or 3 times the amount you are risking. You can also use a trailing stop-loss to let profits run.
Use in swing and intraday trading
This pattern is very versatile. You can use it for swing trading, which involves holding a position for a few days to a few weeks. The 3 outside up pattern is also useful for intraday trading. Intraday trading involves holding a position for only one day. The pattern works on many different timeframes. However, the most reliable signals are on longer timeframes, such as 4-hour or daily charts.
Combining 3 outside up with other indicators
Combining the 3 outside up candlestick pattern with other indicators is important. It helps confirm the signal and increases confidence in your trading decisions.
Confirmation with RSI/MACD
You can check the relative strength index (RSI), which is a momentum indicator. A good signal happens when the RSI moves out of the oversold zone (below 30). This confirms buying strength. You can also use the moving average convergence divergence (MACD) indicator. A MACD bullish crossover confirms a shift in momentum.
Volume analysis
Volume is the most important confirmation tool. Look for a large increase in volume on the second and third candles. High volume shows strong buying interest. It means many people are supporting the new trend. Low volume on the reversal makes the signal weak.
Moving averages
You can use moving averages to confirm the broader trend. If the price is below the 50-day EMA, it is in a downtrend. A 3 outside up pattern is a reversal signal. For extra confirmation, wait for the price to cross above the 50 EMA. This confirms the new uptrend.
Fibonacci retracement zones
The pattern is stronger at a key Fibonacci retracement level. These levels are areas of potential support. If the pattern forms at a 50% or 61.8% Fibonacci level, it is a stronger signal. It means the reversal is happening at a significant price zone.
Opposite pattern – 3 outside down
The 3 outside down pattern is the exact opposite of the 3 outside up. It is a bearish reversal pattern. It signals a potential downtrend and appears after a clear uptrend.
| Features | 3 Outside Up | 3 Outside Down |
|---|---|---|
| Trend | Downtrend | Uptrend |
| First Candle | Small bearish | Small bullish |
| Second Candle | Large bullish | Large bearish |
| Third Candle | Bullish, closes higher | Bearish, closes lower |
| Signal | Bullish reversal | Bearish reversal |
You can expect the 3 outside down pattern at the end of an uptrend. It works the same way as the 3 outside up candlestick pattern. The first bullish candle shows weakening momentum. The second bearish candle engulfs it. This shows sellers are taking over. The third bearish candle confirms the new downtrend.
Pattern accuracy and statistics
Pattern accuracy is about how often a pattern works. Researchers look at past data to find the historical success rate, which is the percentage of times the pattern leads to a successful trade. Studies show that the 3 outside up pattern has a good success rate. It is more reliable than many other simple patterns.
Backtesting insights are also potentially useful. They show how the pattern performed in the past. This helps traders see how it works in different market conditions. It can show if the pattern works better on specific assets or timeframes.
The good news is that this pattern can work under some circumstances in many markets. It is effective in the stock market but also works well in the forex market. The pattern is best used with liquid instruments. It gives more reliable signals on them.
Statistical research has shown the pattern’s effectiveness. However, the 3 outside up candlestick pattern does not have a universal win rate. Some studies show a success rate as high as 70%, while others suggest a 35% success ratio, especially if additional confirmation tools are not used. The pattern’s reliability is significantly increased when combined with other technical indicators, a support zone, or strong confirmation from volume and momentum indicators, turning it into a more robust bullish reversal signal.
Advantages and disadvantages of the pattern
To make the most of any technical indicator, you must know its strengths and limitations. A key advantage of the 3 outside up pattern is that it is easy to recognise. The 3-candle sequence is clear and easy to spot on charts. When used with other indicators, it is a very powerful signal. The third candle provides a solid confirmation. This pattern is great for identifying trend reversals. The 3 outside up candlestick pattern is designed for this purpose. It is effective at calling a potential end to a trend.
However, the pattern can give false signals in ranging or sideways markets. It needs a clear trend to be a reliable tool. Since it requires confirmation with the third candle, it could mean a delayed entry. Some of the initial price move may be missed. The entry is not as early as with a 2 -candle pattern. Also, remember that using the pattern alone is risky. Without volume or momentum confirmation, the signal may be weak. Risk management is an important part of trading this pattern.
Mistakes to avoid when trading the pattern
Here are some common mistakes that you should be aware of to avoid them.
- Entering too early: don’t enter a trade before the third candle closes. You need to wait for full confirmation. An incomplete pattern is unreliable.
- Ignoring the broader trend: always check the overall market trend. A 3 outside up pattern works best after a clear downtrend. Trading against a strong long-term trend is very risky.
- Lack of risk management: always use a stop-loss. Do not risk more than you can afford to lose. This is vital for all trading strategies.
- Ignoring confirmation: never use the pattern in isolation. Always confirm with volume. Use other indicators like RSI or MACD.
Similar candlestick patterns
Many 3 candlestick patterns are similar. Knowing the differences is important.
3 inside up
This is a weaker bullish reversal pattern. The second candle is smaller. Its body is inside the first candle’s body. The third candle is still a confirmation.
Morning star
This is also a 3-candle bullish reversal pattern. It has a long bearish first candle. The second candle is very small. It can be a doji or a spinning top. The third candle is a long bullish one.
Bullish engulfing
This is a 2-candle pattern that consists of the first 2 candles of the 3 outside up. It is a bullish reversal pattern. The second candle engulfs the first. But it lacks the third candle for confirmation. This makes the 3 outside up more reliable.
| Pattern | Structure | Signal Strength |
|---|---|---|
| Bullish Engulfing | 2 candles, second engulfs first | Medium |
| 3 Inside Up | First bearish, second small bullish inside, third bullish | Medium-High |
| 3 Outside Up | First bearish, second bullish engulfs, third bullish | High |
| Morning Star | First bearish, second small, third bullish | High |
Ready to apply the 3 outside up candlestick pattern to your trading strategy? Open a live account.