What is a gravestone doji and how can you trade it?
Learn how to identify and trade the gravestone doji – a candlestick pattern that may signal a potential reversal from bullish to bearish sentiment.
What is a gravestone doji?
A gravestone doji is a candlestick pattern that occurs when the open, low, and close prices all align at the same – or nearly the same – level. It’s considered a bearish reversal indicator, signalling a potential shift in trading psychology, especially when it appears after an uptrend. The pattern suggests increased selling pressure and potential price weakness.
A textbook gravestone doji forms within a single trading session. Early in the session, buyers push the price higher. However, by the end of the session, sellers regain control, driving the price back down to the opening level.
The candlestick is characterised by a long upper shadow, with no real body or lower shadow – creating a flat base at the session’s low. This shape reflects the failure of buyers to maintain upward momentum.
A gravestone doji is one of several types of doji candlesticks – patterns defined by minimal or absent real bodies – each offering unique insights into market sentiment.
How does a gravestone doji form on a chart?
You can follow these steps to identify the gravestone doji by observing its distinctive candlestick:
- Long upper wick – buyers initially drive prices higher but cannot maintain momentum, allowing sellers to pull prices back down, creating an extended upper wick.
-
Minimal or no real body – the candle’s open, close and low prices are at a similar level, which results in a very small or virtually nonexistent body that reflects market indecision.
-
No lower shadow – the open and close are positioned near the session low, and the lower shadow is visually absent or slight.
-
Doji position – look for the gravestone doji near a resistance level or at the end of an extended upward move, indicating that bullish momentum is waning and a bearish reversal could follow.
-
Confirming market conditions – volume analysis can provide additional validation.
What does the gravestone doji indicate in trading?
In technical analysis, a gravestone doji signals a possible shift from bullish to bearish market sentiment. It forms during a trading session in which buyers initially drive the price upwards, but sellers eventually regain control – pulling the price back down to near its opening level by the close.
Visually, the gravestone doji is characterised by its open and close occurring at, or very near, the same price – emphasis lies on the long upper shadow – which signals the rejection of higher price levels.
When a gravestone doji emerges after an extended uptrend or near resistance, it may signal weakening buying pressure and a potential bearish reversal.
Past performance is not a reliable indicator of future results.
How to trade using the gravestone doji candlestick pattern
Confirm the bearish reversal
Before trading the gravestone doji, confirm the pattern by looking for a subsequent candle that closes at or below the gravestone doji's low. The bearish signal is further validated when the price continues to decline after the pattern is complete. Increased trading volume or alignment with other technical indicators, can provide further confirmation.
Entry strategy
If you decide to trade, choose a position based on factors such as your risk tolerance, trading strategy, and market conditions. Common approaches include opening short trades once the pattern is confirmed – or reducing existing long positions in response to a confirmed gravestone doji. This might involve entering immediately after confirmation, or waiting for a brief retest of resistance levels.
Determine your stop-loss
Use risk management tools such as stop-loss and take-profit to limit potential losses whilst locking-in potential gains. Consider prevailing volatility and individual preferences. Adjust stop-loss levels to accommodate market volatility, ensuring adequate breathing room without risking excessive capital. Stop-losses aren’t guaranteed, while guaranteed stop-loss orders (GSLO) – available on our platform – incur a fee when activated.
Identify your profit targets
Examine key support levels below the gravestone doji formation to inform your profit targets. Some common strategies involve targeting previous support levels, moving averages or Fibonacci retracements. Alternatively, measure the preceding upward movement and project an equivalent distance downward from your entry point.
Combine with additional indicators
Use technical indicators such as the relative strength index (RSI) or moving average convergence divergence (MACD) to inform trading decisions. Bearish divergences – when indicators form lower highs while price action makes higher highs – can add further weight to the bearish reversal signal implied by the gravestone doji.
Manage risk and trade size carefully
Align your position size with your overall risk management approach, trading strategy, and account size. Never risk more than you can afford to lose on a single trade.
Remember, past performance is not a reliable indicator of future results.
Chart examples: Gravestone doji
Traditional investors might watch for bearish signals only to reduce exposure. By contrast, contracts for difference (CFDs) let you speculate on both rising and falling markets – without owning the underlying asset – so a gravestone doji can present opportunities for either taking short positions or exiting longs.
CFDs are traded on margin, which involves leverage. Leverage beyond 1:1 magnifies both potential gains and potential losses. Here’s a hypothetical CFD scenario:
Gravestone doji example – UK 100 index CFD
-
Formation – after climbing from 7850 to 8000, the UK 100 prints a gravestone doji at 8010.
-
Position and leverage – you decide to sell one UK 100 CFD at 8005 with a stake of £5 per point. Your notional exposure is about £40,025, but 5:1 leverage means a margin requirement of roughly £8,005 (20% of notional).
-
Outcome – the price falls to 7900, the notional profit is £525 (105 points × £5), and your return on margin is 6.6% – minus spread and applicable charges.
However, had the price moved against your position – rising to 8070 – your loss would be £325 (65 points × £5). If the index reaches 8150, the loss grows to £725 (plus spread and applicable charges) and this may result in a margin call or automatic closeout, depending on your available margin.
Explore our comprehensive guide to CFD trading vs traditional investing.
What’s the difference between a shooting star and a gravestone doji?
The gravestone doji and the shooting star are candlestick patterns that can indicate potential weakness near price highs, but there are distinct differences in their formation and interpretation.
Gravestone doji
The gravestone doji candlestick doesn’t have a body, because its open and close prices are almost identical. This minimal or absent body often reflects strong bearish rejection after an initial bullish move. Buyers push prices higher, but sellers drive them back down to close near the session low.
Shooting star
In contrast, the shooting star candlestick has a small body near the session low, with a long upper shadow. Unlike the gravestone doji, the shooting star's body shows a clear difference between opening and closing prices, though this difference remains small. A shooting star can indicate that buyers initially gain control, but strong selling pressure quickly emerges, leaving a bearish signal.
Read our trader’s shooting star guide or discover more technical analysis indicators.
Gravestone doji vs other doji candlesticks
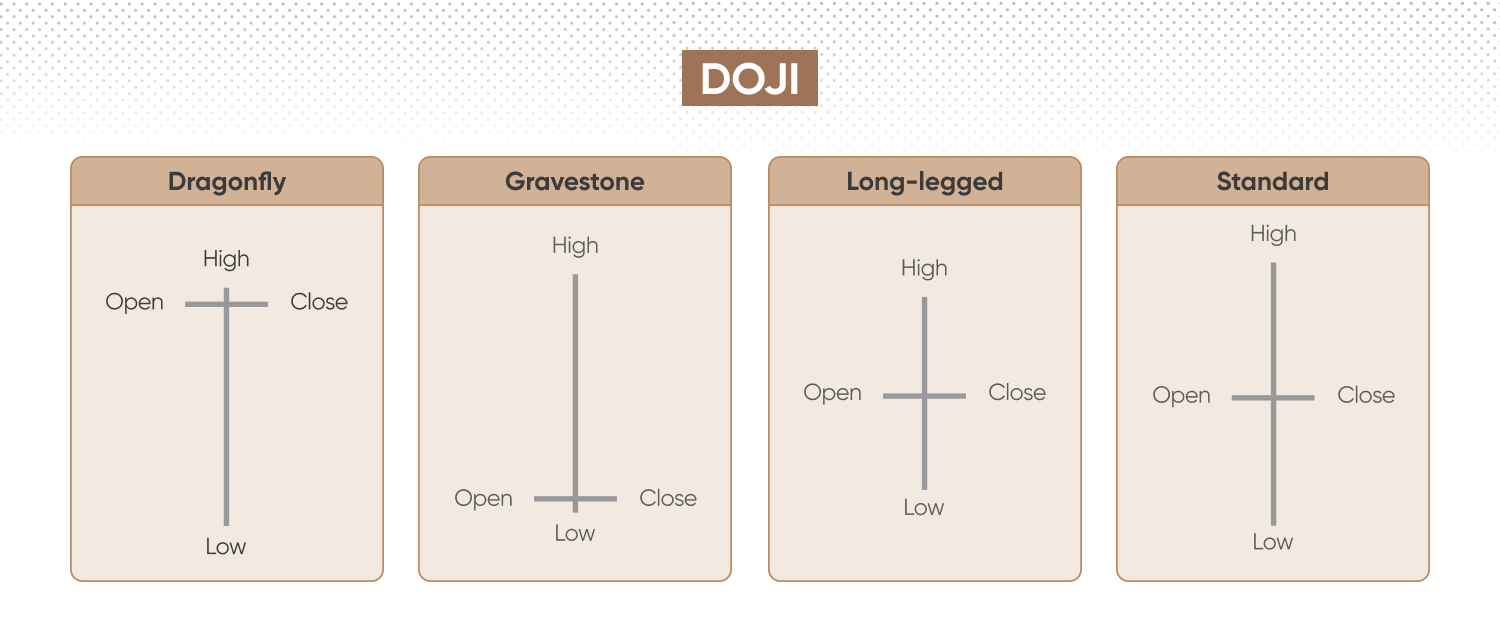
While all doji candles highlight market indecision through their minimal or absent real bodies, each doji pattern provides unique trading signals.
-
The gravestone doji is often interpreted as having potential bearish implications. Its long upper shadow may signal selling pressure at higher price levels, which can indicate a possible shift from bullish to bearish sentiment.
-
Dragonfly doji candles may suggest the opposite scenario – buyers rejecting lower prices, which may precede a reversal from bearish to bullish conditions.
-
The long-legged doji typically reflects substantial uncertainty, sometimes accompanied by increased volatility, and often prompts traders to remain cautious and seek further confirmation.
-
The standard doji, meanwhile, generally signals neutrality without strong directional bias.
|
Formation |
Potential signal |
Trading insight |
|
|
Gravestone doji |
Long upper wick, little to no lower wick, open and close near the session low |
May flag a bearish reversal, particularly at resistance or after an uptrend |
May imply fading buyer momentum as sellers regain control; confirmation advised |
|
Dragonfly doji |
Long lower wick, little to no upper wick, open and close near the session high |
May signal a bullish reversal, often near support or following a downtrend |
May imply fading seller momentum as buyers step in; confirmation advised |
|
Long-legged doji |
Long upper and lower wicks, minimal real body at midpoint |
High indecision, with heightened volatility possible |
Signals uncertainty; traders often wait for confirmation from subsequent candles |
|
Standard doji |
Very short upper and lower wicks; tiny or absent real body at midpoint |
General indecision, neutral sentiment |
Traders usually await the next candle for clearer direction |
FAQ
What does doji gravestone indicate?
A gravestone doji indicates potential bearish momentum after an uptrend or near resistance levels. Buyers initially push prices higher during the session, but sellers pull prices back to near the opening level by the close, which can signal buyer fatigue and a possible shift in sentiment. This pattern serves as an early warning of a potential reversal, especially when viewed alongside other market factors.
Is doji bullish or bearish?
The gravestone doji generally signals bearish sentiment when it appears after upward price movements, as it may mark a shift from bullish to bearish momentum. However, context is important, and traders should always seek additional confirmation from subsequent candles and technical indicators to reduce false signals.
What’s the difference between shooting star and gravestone doji?
A gravestone doji has virtually no real body, so the open and close prices are almost identical; this shape emphasises the market’s rejection of higher prices. A shooting star, by contrast, shows a small real body near the session’s low. Both patterns can flag potential bearish reversals, but the gravestone doji generally provides a stronger warning when it forms at resistance or after a rally. In all cases, traders should confirm the signal with subsequent price action.
Does a doji gravestone have to be red?
No, a gravestone doji does not have to be red. The candle’s colour – red or green – is not significant for this pattern, as the open and close sit very close together. The shape and location of the gravestone doji on the chart matter most, with the long upper wick indicating that sellers overcome earlier buying during the session.