差價合約 (CFD) 是一種複雜的金融工具,利用槓桿交易雖然可能放大收益,但同樣也會加劇虧損風險,導致資金快速流失。
數據顯示,
78.48% 的散戶投資者在使用該提供商服務進行差價合約交易時出現帳戶虧損。
在進行交易之前,請確保您充分了解差價合約的運作機制,並仔細評估自己是否有能力承擔資金虧損的高風險。
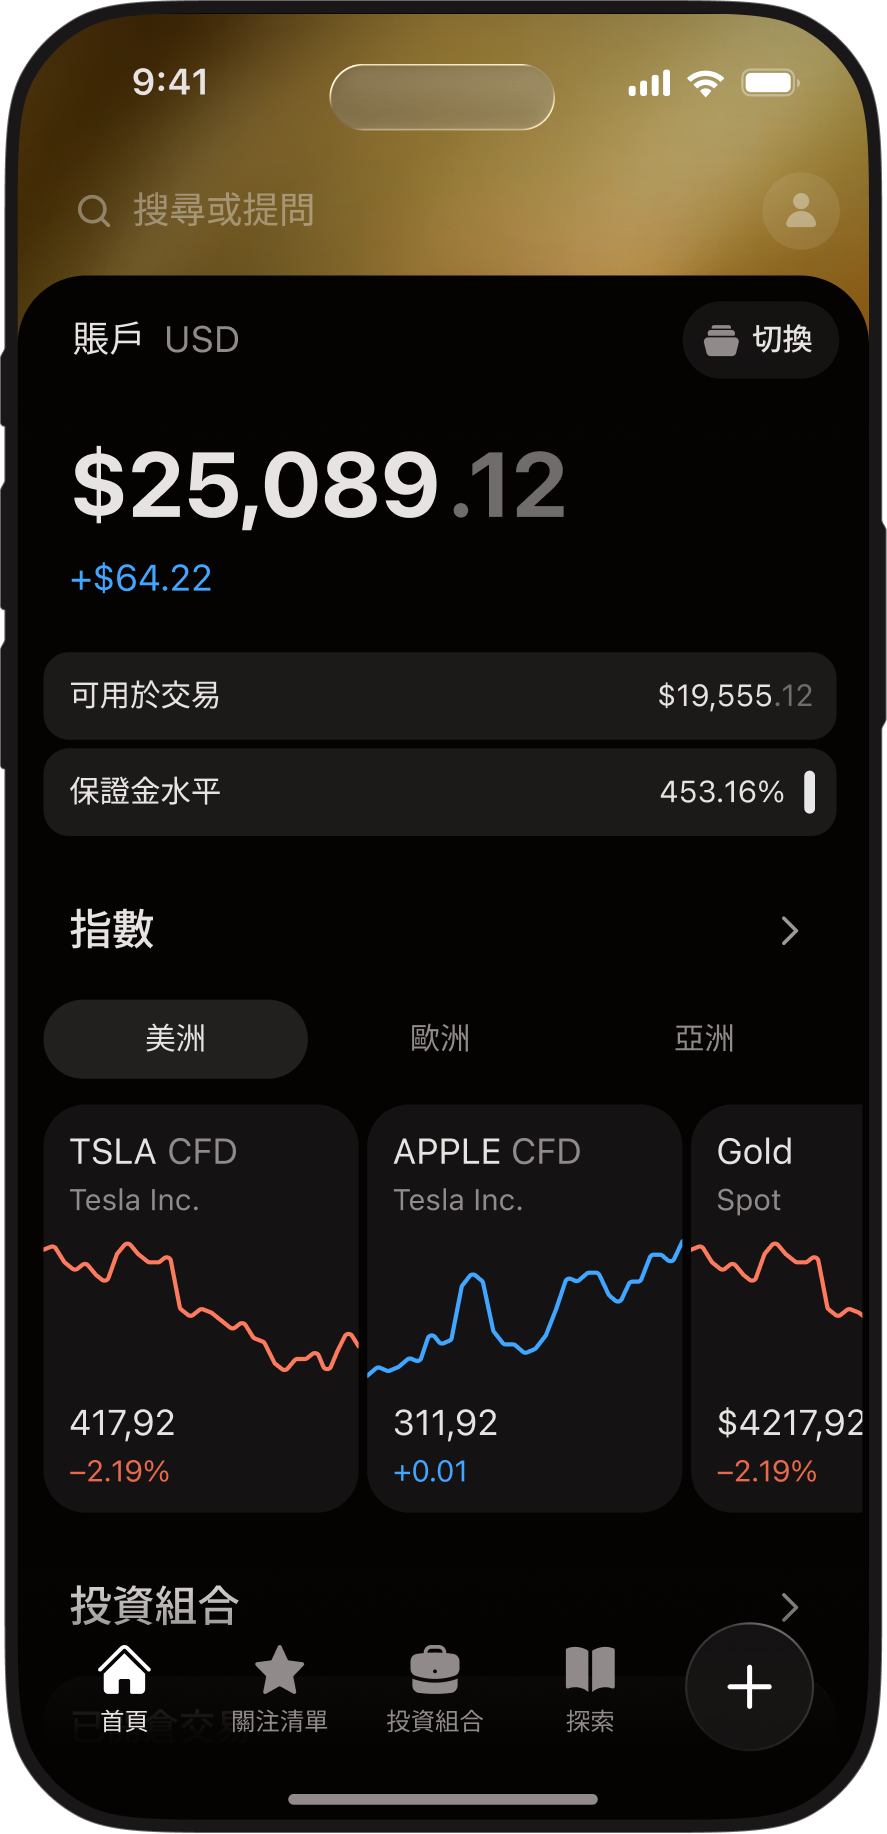
交易
交易
差價合約 (CFD) 交易
模擬交易
專業帳戶
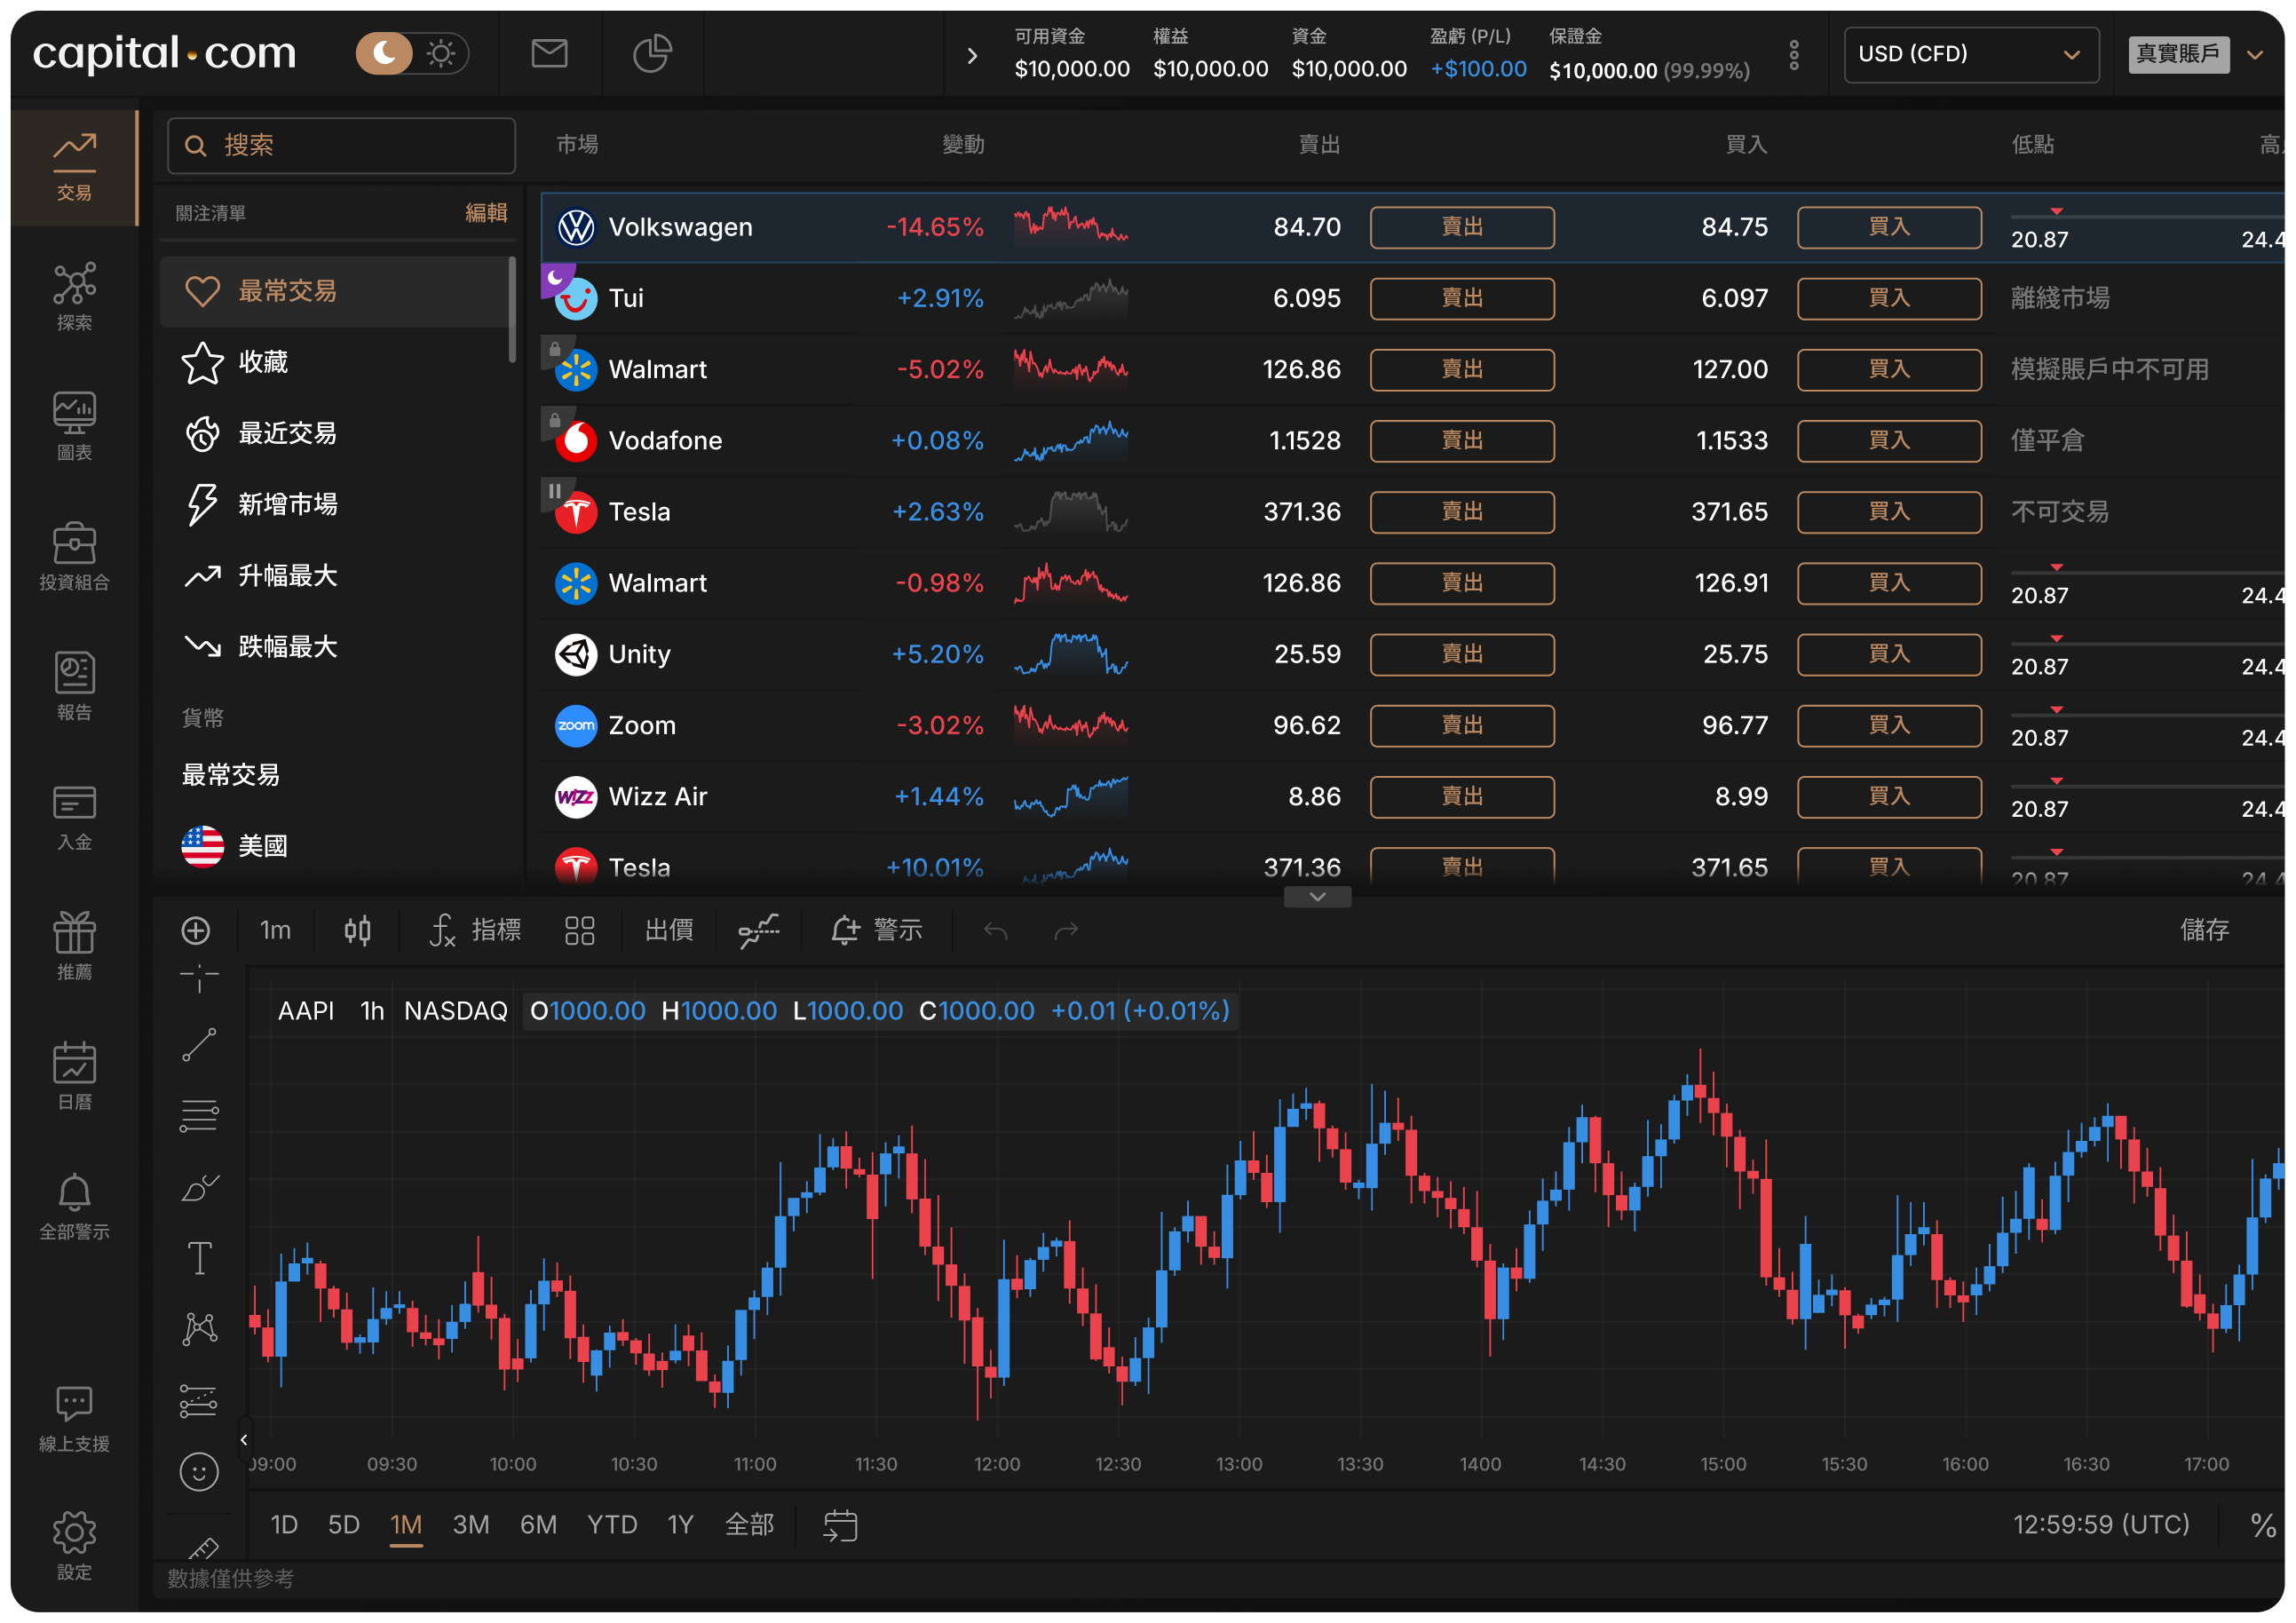
平台
網頁版平台
手機 App
TradingView
MT4
MT5
學習
交易策略
技術分析
交易心理
學習
市場
我們的市場
市場
股票
外匯
指數
大宗商品
加密貨幣
債券
利率
市場洞察
市場分析
定價
關於我們
關於我們
公司簡介
我們的辦公室
Capital.com 安全嗎?
我們的商業模式
與我們合作
合作夥伴計劃
推薦朋友
幫助
幫助
客戶脆弱性
聯絡我們
法律資訊
條款與政策
投訴
登入
開設賬戶
zh
登入
開設賬戶
開設賬戶
打開平台
打開平台
本地支援。
全球連通。
本平台由巴哈馬證券委員會 (SCB) 授權並監管
洞察市場、
明智交易
全球範圍
差價合約 (CFD) 交易平台
5500+ 交易品種
開立帳戶
Android
IOS
MT4
MT5
TradingView
網頁終端
5500+ 交易品種
一個決策環境
探索 CFD 市場
大宗商品
Gold
Oil - Crude
Silver
Oil - Brent
Natural Gas
LCOQ2026
GCQ2026
US Cocoa
Copper
CLQ2026
Gasoil
Platinum
Coffee Arabica
LCOU2026
65 +
市場
加密貨幣
BTC/USD
XRP/USD
ETH/USD
ESPORTS/USD
SOL/USD
XLM/USD
PEPE/USD
DOGE/USD
MYX/USD
RIZE/USD
PLAY/USD
SUI/USD
ADA/USD
UNI/USD
450 +
市場
股票
SPCX
TSLA
MU
MSTR
NVDA
SNDK
AMD
MRVL
INTC
PLTR
MSFT
NFLX
SMCI
GOOGL
4,500 +
市場
債券
US
TY
FLGU6
USU2026
FOATU2026
TYU2026
FGBXU2026
FGBMU2026
TU
FV
SJBU2026
FGBSU2026
FBTPU2026
FBTSU2026
20 +
市場
ETF
SOXL
QQQ
SPY
VOO
SOXX
SMH
TQQQ
UVXY
SQQQ
AGQ
UVIX
GDXJ
IVV
XLK
650 +
市場
指數
US100
J225
US30
DE40
US500
HK50
RTY
UK100
FR40
NQU2026
HSTECH
HSIM2026
VIX
CN50
35 +
市場
利率
FEIU2026
FEIZ2026
FEIH2027
SON3U2026
SON3M2026
SON3Z2026
SON3H2027
FF
SRA
10 +
市場
Gold
Oil - Crude
Silver
Oil - Brent
Natural Gas
LCOQ2026
GCQ2026
US Cocoa
Copper
CLQ2026
Gasoil
Platinum
Coffee Arabica
LCOU2026
65 +
市場
BTC/USD
XRP/USD
ETH/USD
ESPORTS/USD
SOL/USD
XLM/USD
PEPE/USD
DOGE/USD
MYX/USD
RIZE/USD
PLAY/USD
SUI/USD
ADA/USD
UNI/USD
450 +
市場
SPCX
TSLA
MU
MSTR
NVDA
SNDK
AMD
MRVL
INTC
PLTR
MSFT
NFLX
SMCI
GOOGL
4,500 +
市場
US
TY
FLGU6
USU2026
FOATU2026
TYU2026
FGBXU2026
FGBMU2026
TU
FV
SJBU2026
FGBSU2026
FBTPU2026
FBTSU2026
20 +
市場
SOXL
QQQ
SPY
VOO
SOXX
SMH
TQQQ
UVXY
SQQQ
AGQ
UVIX
GDXJ
IVV
XLK
650 +
市場
US100
J225
US30
DE40
US500
HK50
RTY
UK100
FR40
NQU2026
HSTECH
HSIM2026
VIX
CN50
35 +
市場
FEIU2026
FEIZ2026
FEIH2027
SON3U2026
SON3M2026
SON3Z2026
SON3H2027
FF
SRA
10 +
市場
大宗商品
加密貨幣
股票
債券
ETF
指數
利率
不同頁面,
同一系統。
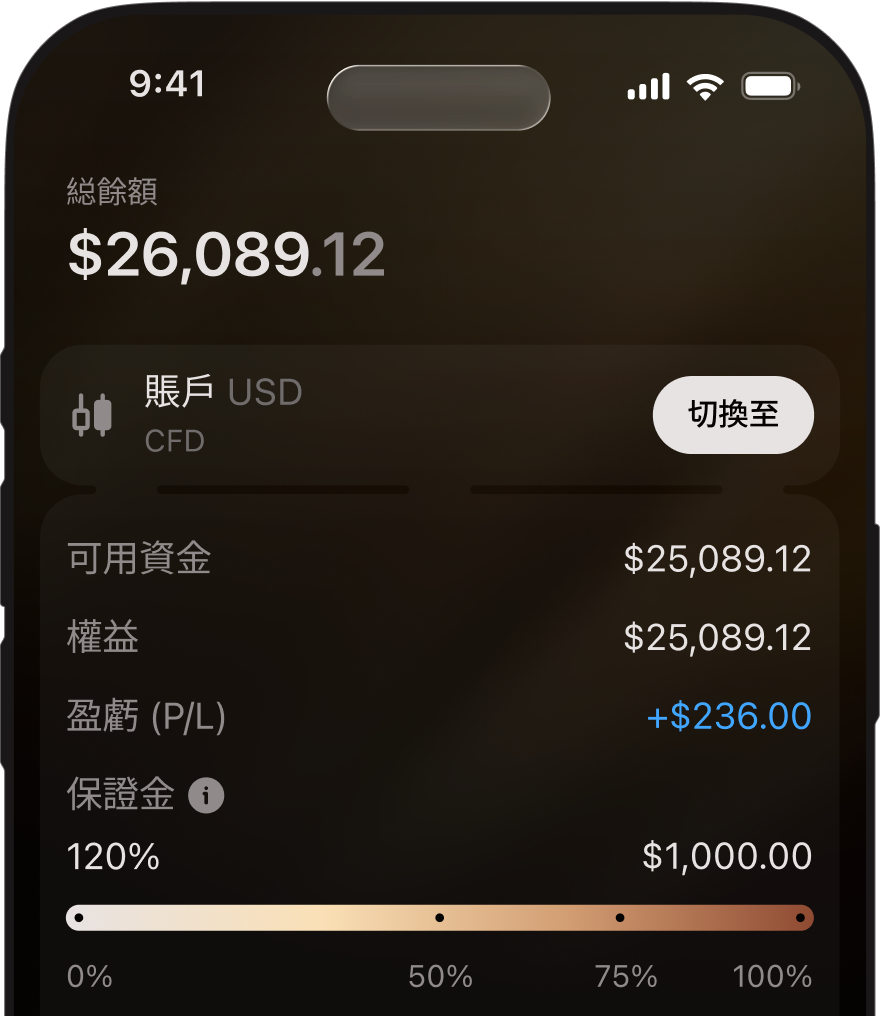
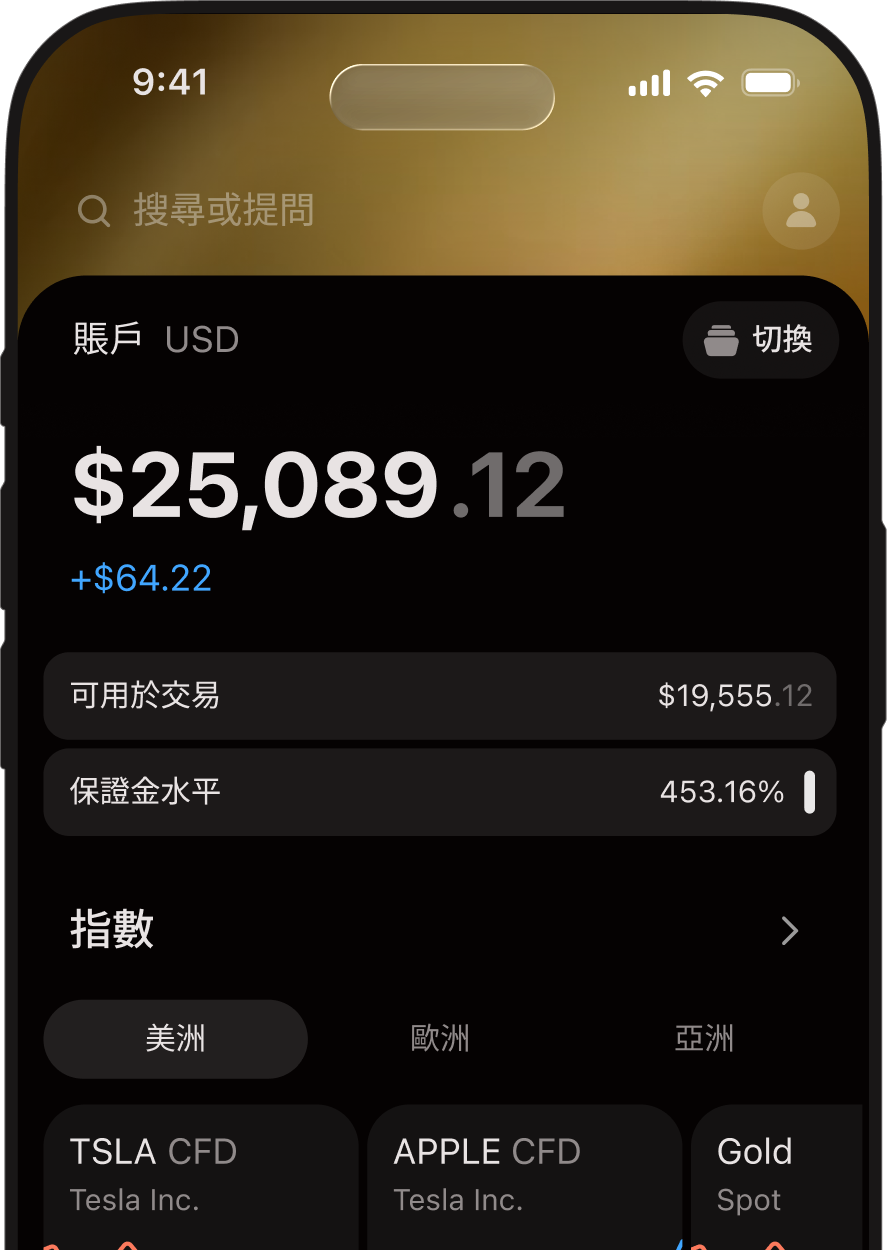
多個平台,所有市場,任何裝置。爲您打造方便智能的交易環境。
透明的費用結構,讓您安心交易
我們的收益來自已執行交易中的點差
清晰透明,一目瞭然。
入金及出金均不收取費用
安全的付款方式。支援銀行轉賬、銀行卡及數碼錢包。
我們的完整費用結構可在我們的
收費及費用頁面查閱。
大多數交易者都會虧損
市場環境會影響投資結果
但真正拉開差距的,是每一次決策
蓄勢待發。
處變不驚。
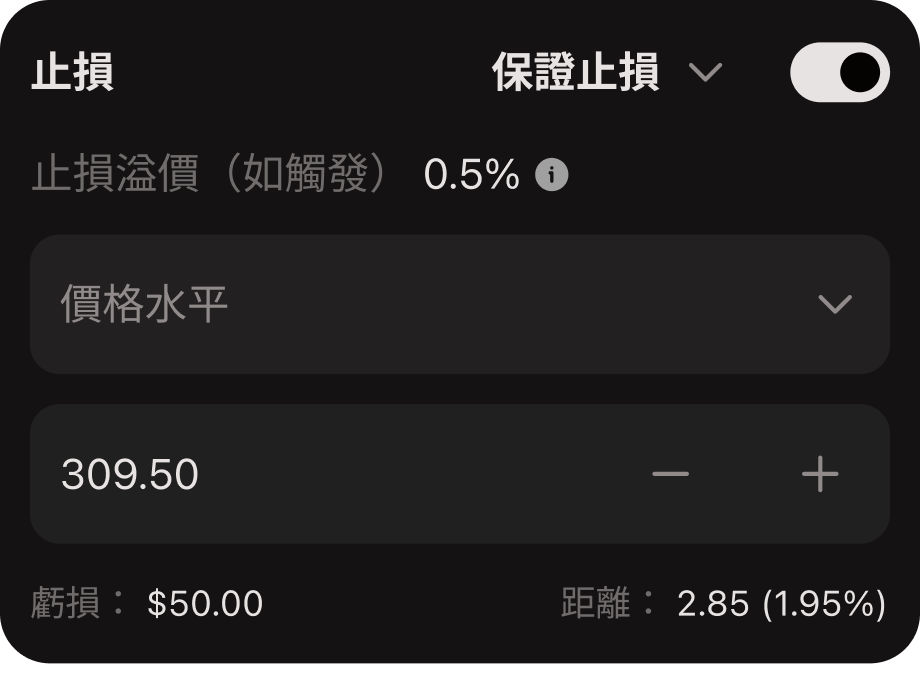
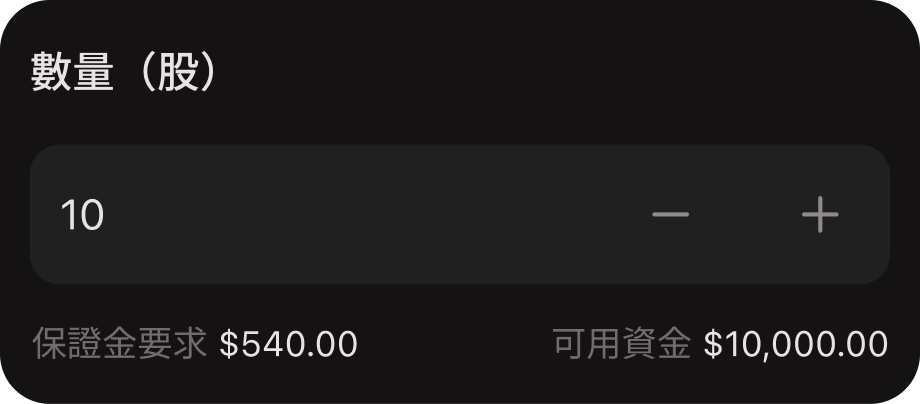
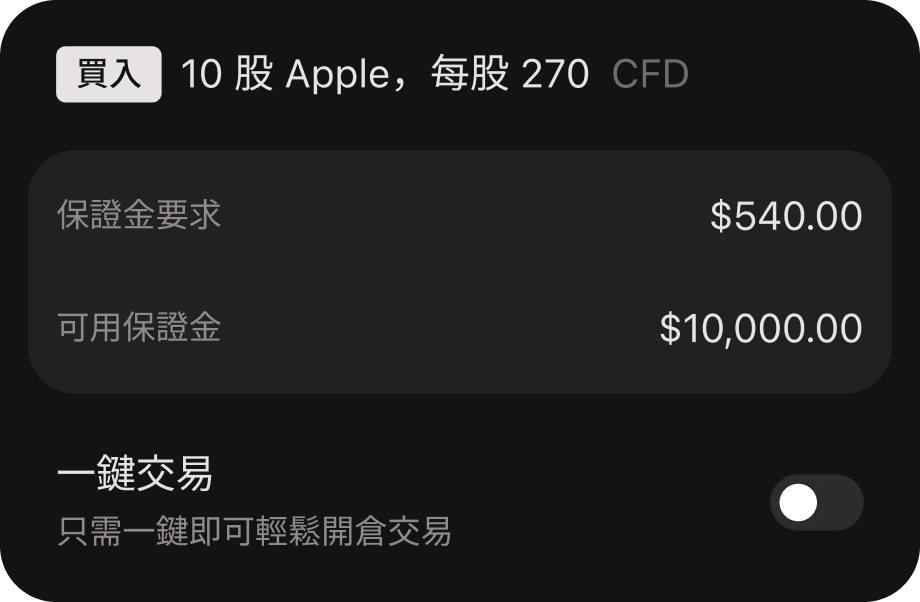
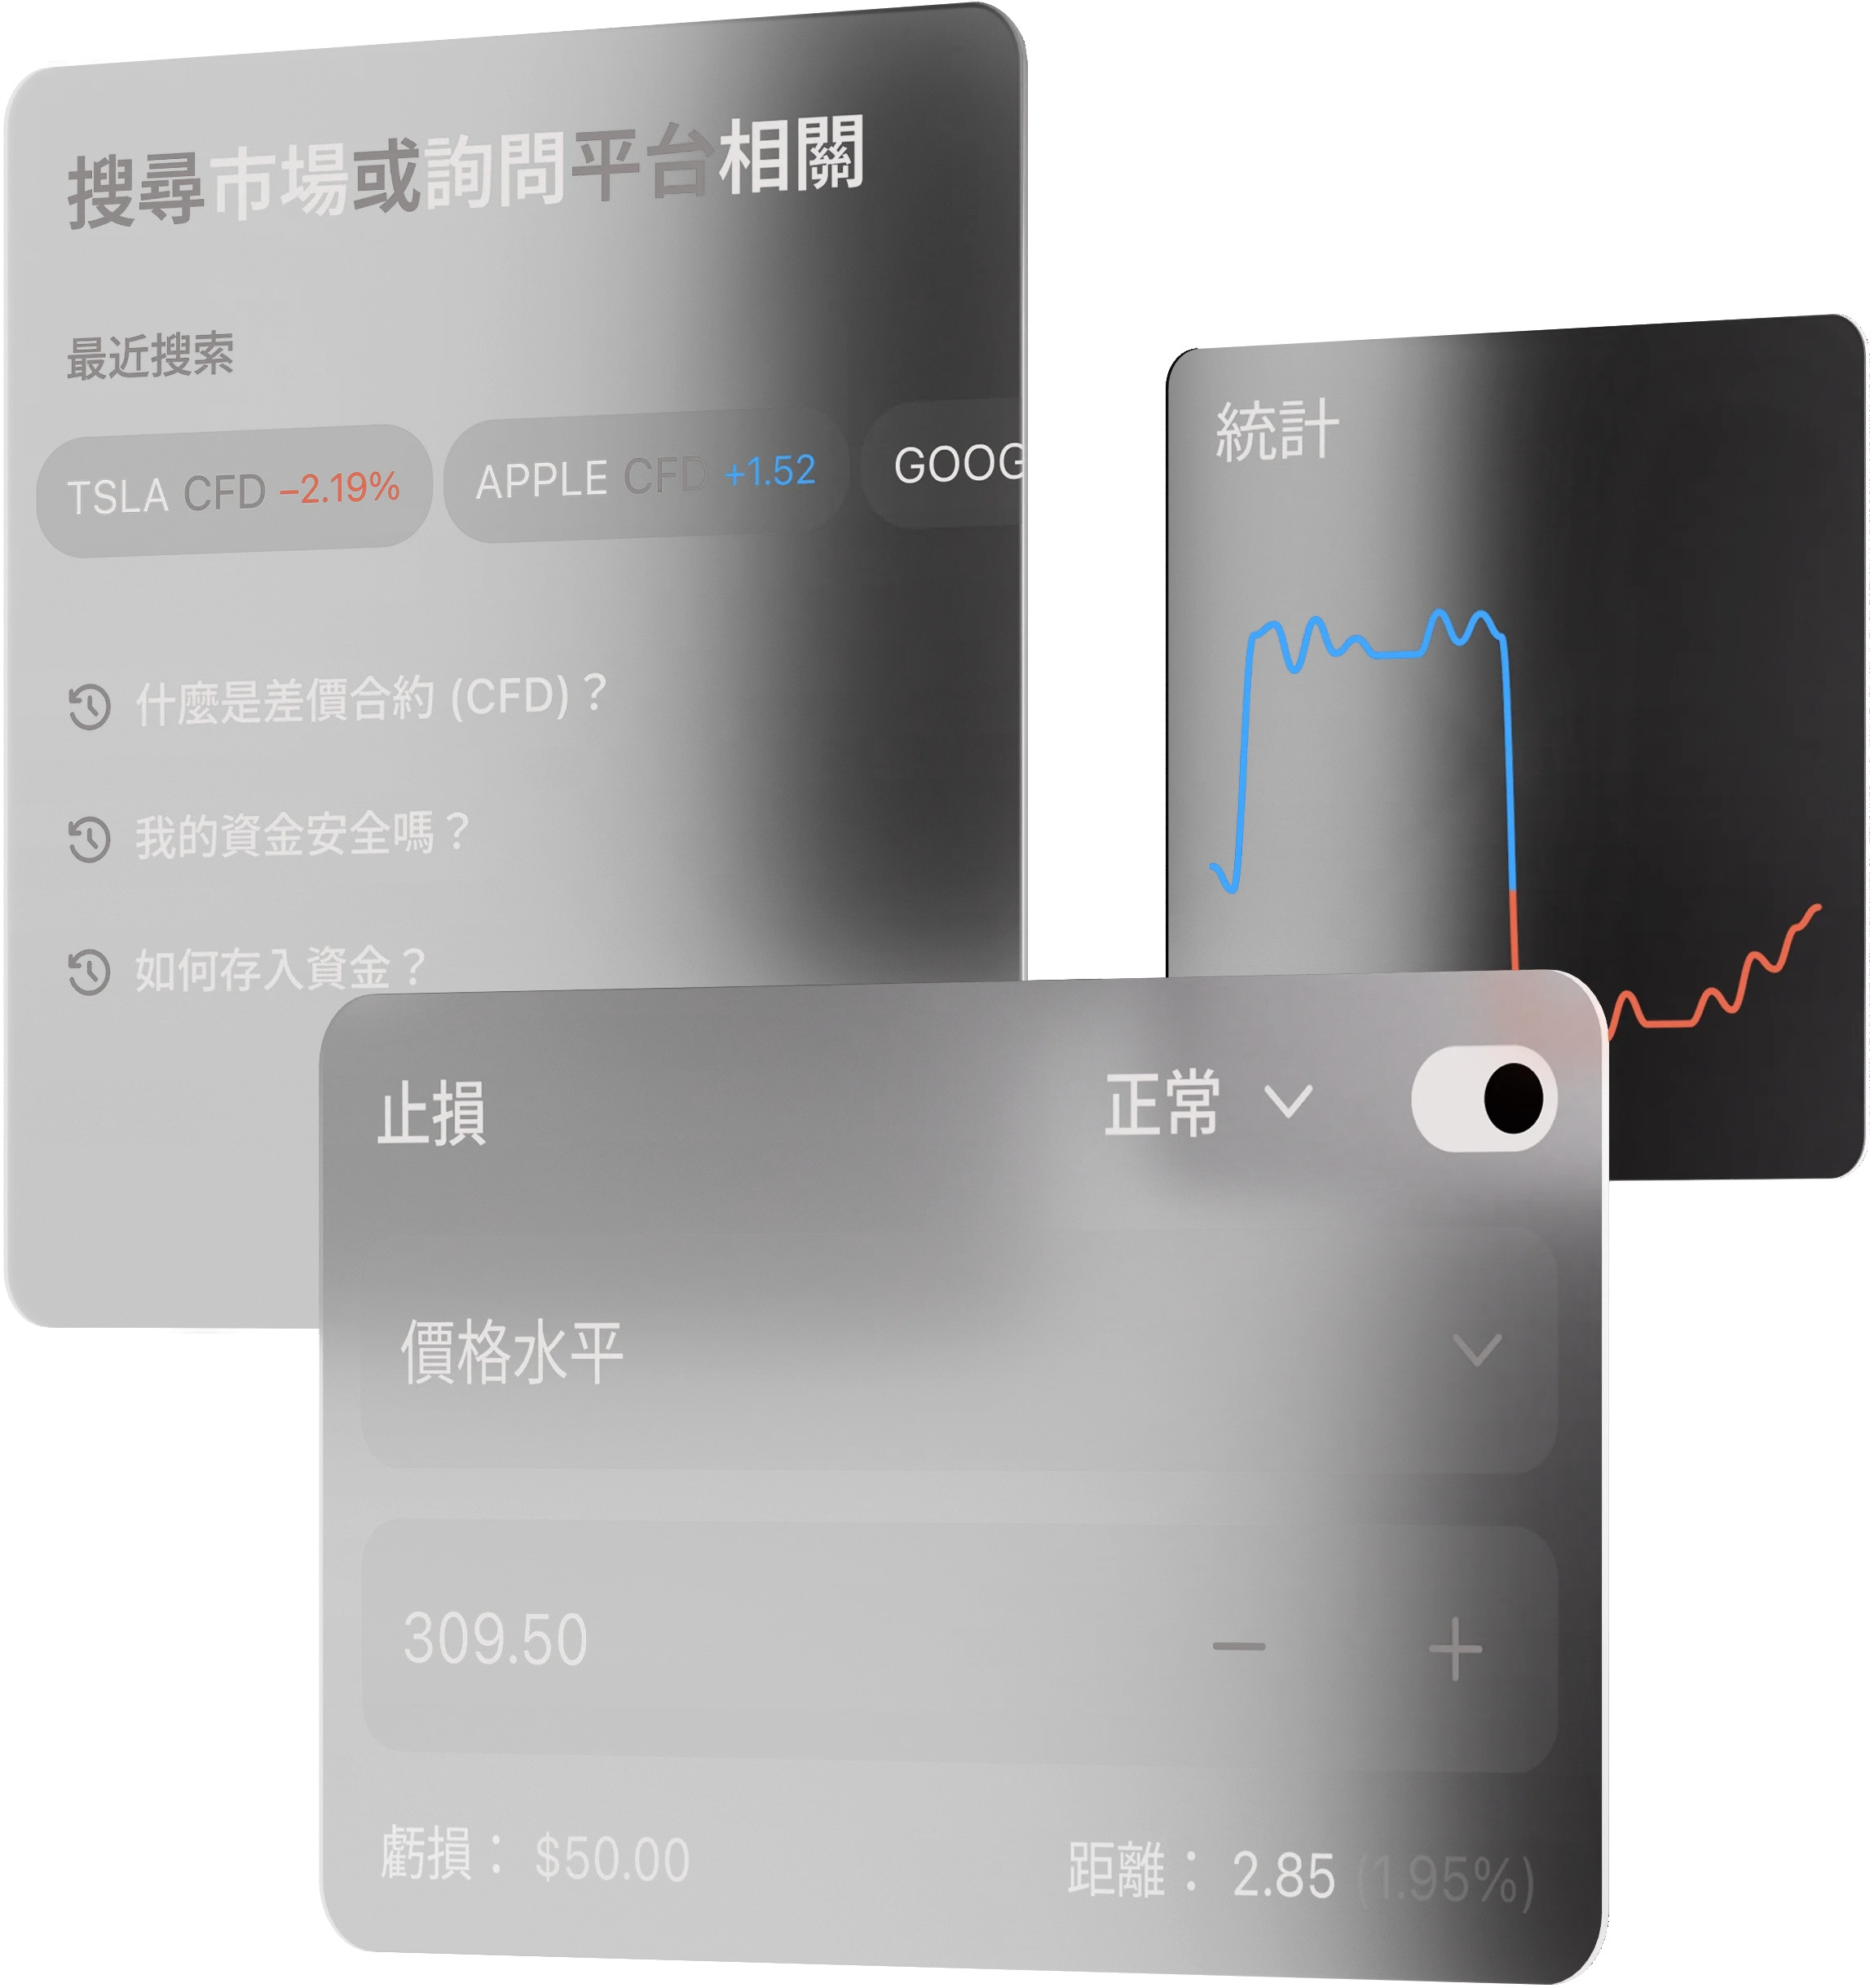
交易前設定止損
選擇槓桿倍數
確認訂單
數據會説話。
信任,同樣經得起驗證。
4.7
評分與評價
4.7
評分與評價
4.6
TradingView
4.6
Trustpilot
4.7
評分與評價
4.7
評分與評價
4.6
TradingView
4.6
Trustpilot
4.7
評分與評價
4.7
評分與評價
4.6
TradingView
4.6
Trustpilot