差價合約 (CFD) 是一種複雜的金融工具,利用槓桿交易雖然可能放大收益,但同樣也會加劇虧損風險,導致資金快速流失。數據顯示,78.48% 的散戶投資者在使用該提供商服務進行差價合約交易時出現帳戶虧損。在進行交易之前,請確保您充分了解差價合約的運作機制,並仔細評估自己是否有能力承擔資金虧損的高風險。

黃金、Hong Kong 50 指數、USD/JPY 等交易品種的差價合約。在便捷、直觀易用的平台上,提供透明點差與零佣金*服務。
*其他費用適用。
本平台由巴哈馬證券委員會 (SCB) 授權並監管
展示我們的 4 星和 5 星好評。為遵守 GDPR 要求並保護用戶隱私,用戶的具體資料已被匿名處理
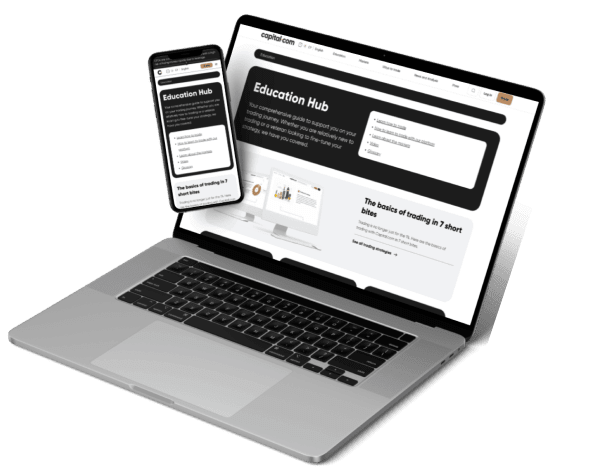
全面且完善的服務、專業工具與優質資源,助您持續提升交易技能。
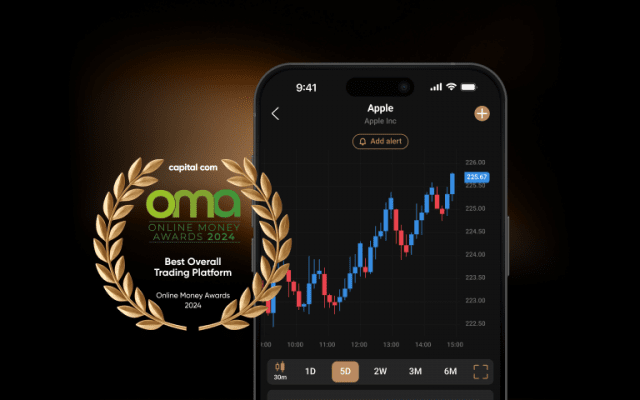
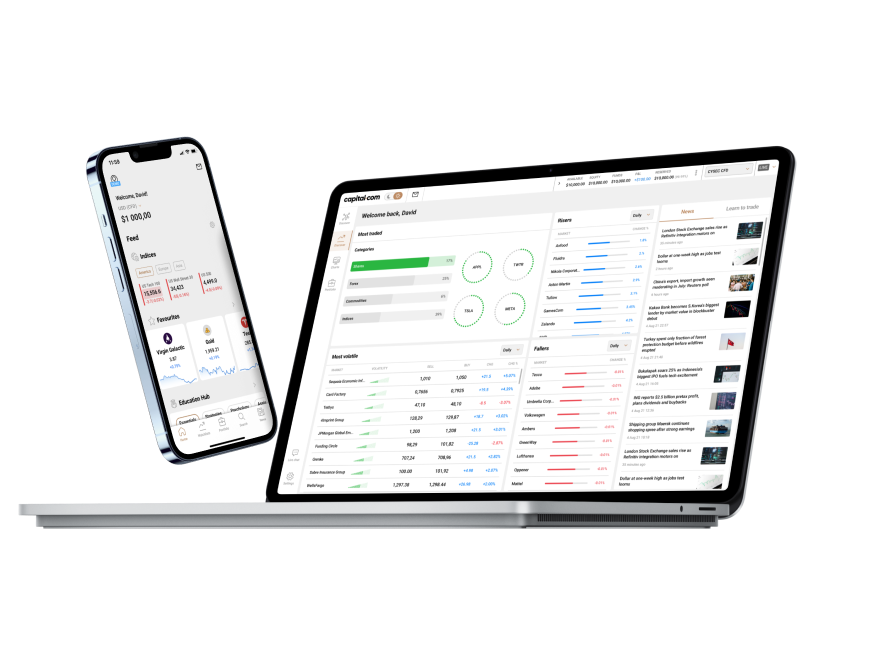
利用 100+ 種技術指標、直觀圖表和繪圖工具,助力市場分析。
在精選市場以低按金掌控更大交易頭寸。杠杆不僅能提升盈利潛力,也會加大虧損風險。可能存在杠杆限制。
我們的專業團隊提供全天候支援服務,隨時為您答疑解惑。
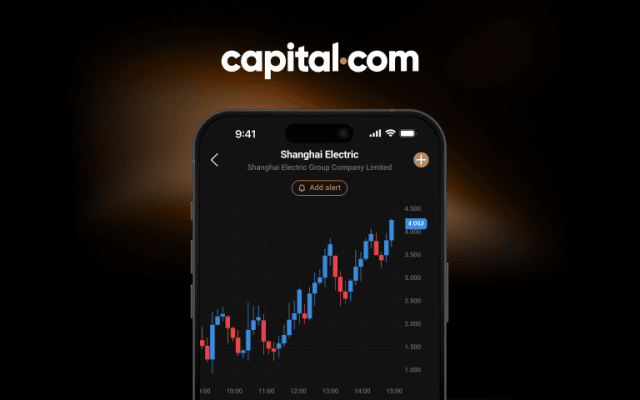
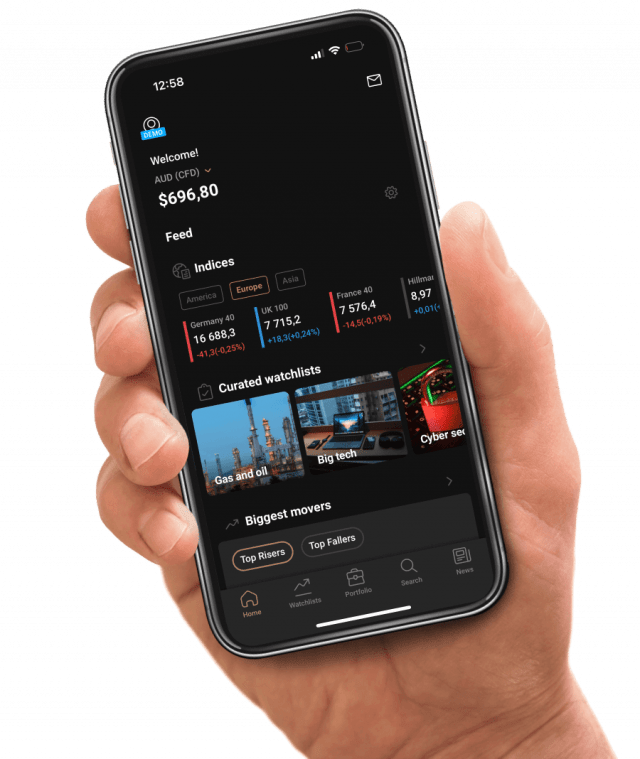
時刻關注您最愛資產的價格走勢,把握市場機遇,優化交易策略。
根據我們 2024 年的內部伺服器數據,99% 的出金請求在 24 小時內處理完畢。
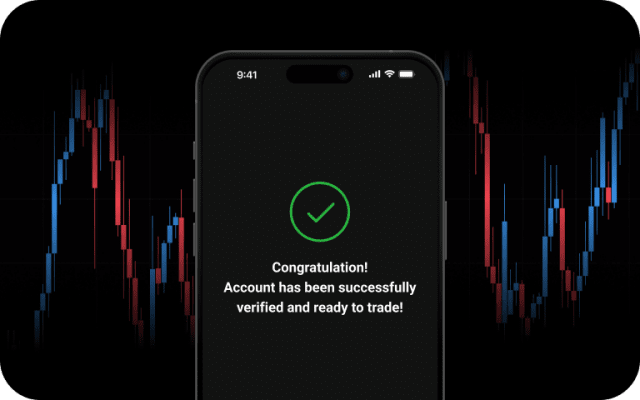
選擇 Capital.com,開啟您的交易之旅。
零風險體驗交易,輕鬆積累實戰經驗。
享受專業且友好的全天候客戶支援服務。
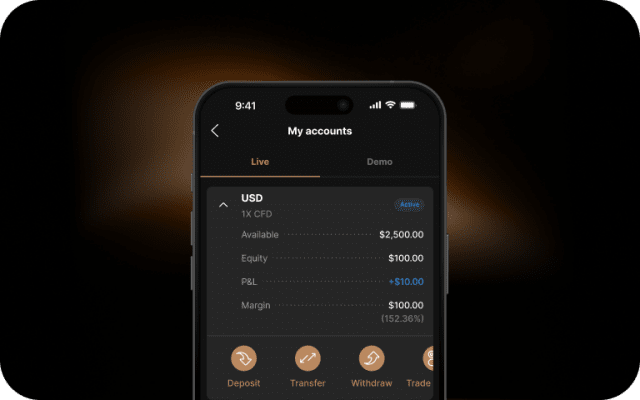
靈活設定交易規模,優化資金管理,穩健掌控風險。
使用止蝕單1在市場走勢對您不利時及時止蝕。
1止蝕可能無法保證執行