STMicroelectronics stock forecast: Tariff pressure
STMicroelectronics is a European semiconductor group facing tariff uncertainty, supply-chain cost pressure and uneven demand recovery ahead of its Q1 2026 results on 23 April 2026. Past performance is not a reliable indicator of future results. Explore third-party STM price targets and technicals.
STMicroelectronics N.V. (STM) is trading at $32.11 as of 11:24am UTC on 8 April 2026, having moved within an intraday range of $29.97–$32.48. Past performance is not a reliable indicator of future results.
Sentiment toward STM is weighed by a confluence of factors. The wider European technology and semiconductor sector has come under pressure amid ongoing global trade tariff uncertainty following the Trump administration's 'Liberation Day' reciprocal tariff announcements, with country-specific levies of up to 20% on EU goods taking effect in stages from early April 2026, according to J.P. Morgan Global Research (J.P. Morgan, 17 March 2026). While STM itself had previously navigated tariff-related headwinds, it said there was no immediate change in customer behaviour as recently as Q1 2026, when the company projected first-quarter revenue of approximately $3.04 billion ahead of formal disclosure on 23 April 2026 (Reuters, 29 January 2026). Additionally, broader sector dynamics remain in focus, with automotive and industrial semiconductor demand recovery still in progress and wafer foundry price increases of 10%–15% reported across key mature process nodes, adding potential pressure to input costs across the supply chain (Amble MarketPulse, 2 April 2026).
STMicroelectronics stock forecast 2026–2030: Third-party price targets
As of 8 April 2026, third-party STMicroelectronics stock predictions reflect divergent views on the pace of end-market recovery, near-term margin pressure, and the broader impact of trade tariff uncertainty on the semiconductor supply chain.
Weiss Ratings (sell-rating downgrade)
Weiss Ratings downgrades STM from hold (c-) to sell (d+), placing it at the most cautious end of the current coverage spectrum, with no accompanying price target. The downgrade comes amid thin reported profitability, with STM posting a net margin of 1.41% and a return on equity of 2.70% following Q4 2025 results (MarketBeat, 7 April 2026).
Morgan Stanley (overweight upgrade)
Morgan Stanley upgrades STM from equal weight to overweight, marking a constructive shift in the bank's view after a period of more neutral positioning. The upgrade follows Q4 2025 revenue of $3.33 billion, a marginal beat against the $3.29 billion consensus estimate, with the bank appearing to weigh longer-term recovery potential in STM's microcontroller and power semiconductor segments (TipRanks, 26 March 2026).
Public.com (consensus snapshot)
Public.com aggregates ratings from four analysts and reports a consensus rating of Buy, with an average 12-month STM stock forecast of $34.25. The breakdown stands at 25% strong buy, 50% buy, and 25% hold, with no sell or strong sell recommendations recorded in this subset of coverage (Public.com, 1 April 2026).
MarketBeat (14-analyst consensus overview)
MarketBeat aggregates 14 analysts and reports a consensus Hold rating, with an average 12-month price target of $31.93, spanning a range of $28–$40. The spread reflects divergent assumptions on margin recovery timing, with seven buy, five hold, and two sell ratings recorded, ahead of the Q1 2026 earnings release scheduled for 23 April 2026 (MarketBeat, 7 April 2026).
Susquehanna (positive rating, target raised)
Susquehanna carries the highest individual price target among covering analysts at $40, raised from $35, with a positive rating maintained. The $40 target embeds assumptions around a more sustained recovery in industrial and automotive chip demand in the second half of 2026, as STM's end-market mix is heavily skewed toward those segments (GuruFocus, 23 February 2026).
Predictions and third-party forecasts are inherently uncertain, as they cannot fully account for unexpected market developments. Past performance is not a reliable indicator of future results.
STM stock price: Technical overview
The STM stock price trades at $32.11 as of 11:24am UTC on 8 April 2026, sitting below the classic pivot point at $33.17 and within the session range of $29.97–$32.48. According to TradingView data, the broader moving-average structure remains constructive: the 20/50/100/200-day SMAs sit at approximately $33 / $32 / $29 / $28, all carrying buy signals, with the 20-over-50 alignment intact across the SMA family.
Momentum readings from TradingView are mixed. The 14-day relative strength index stands at 61.47, in upper-neutral territory, indicating neither an overbought nor oversold condition. The average directional index (14) at 14.50 falls just below the 15 threshold, suggesting the current directional move remains weak in conviction. The MACD (12, 26) holds a buy signal at 0.64, while the Hull moving average (9) at $35.75 registers a sell signal, reflecting softer near-term momentum relative to the longer-term trend.
On the upside, the classic R1 at $35.97 is the nearest reference above the current price; a daily close above that level could bring R2 near $37.40 into view. To the downside, the classic pivot at $33.17 represents the initial reference, followed by the 50-day SMA near $32.49; losing that shelf could open a move toward S1 near $31.75, according to TradingView pivot data (TradingView, 8 April 2026).
This is technical analysis for informational purposes only and does not constitute financial advice or a recommendation to buy or sell any instrument.
STMicroelectronics share price history (2024–2026)
STM’s stock price opened April 2024 around $39.67. The stock climbed into mid-July 2024, touching $39.56 on 12 July 2024 before a sharp reversal pulled it to $29.63 by 1 August 2024 – a drop of roughly 25% in under three weeks – as the company flagged softer automotive and industrial demand in its Q2 2024 results.
The slide continued into year-end, with STM closing 2024 at $24.37. A brief post-earnings rebound faded quickly in late January 2025, and the stock extended its losses through the first quarter as a sector-wide inventory correction and tariff uncertainty weighed on sentiment. STM hit a two-year low of $16.94 on 7 April 2025 – more than 57% below its mid-2024 peak.
Recovery took hold from May 2025, with the stock climbing back above $26 by June and holding within a range of roughly $19–$29 through the rest of the year. STM closed 2025 at $22.35, down approximately 8.3% on the year. The new year brought renewed momentum, with the stock clearing $32 in early April 2026.
STM closed at $32.10 on 8 April 2026, approximately 36.9% up year to date from its 2 January 2026 close of $23.45, and approximately 85.7% up year on year from $17.29 on 8 April 2025.
Past performance is not a reliable indicator of future results. Share prices are indicative and may differ from live market prices.
STMicroelectronics (STM): Capital.com analyst view
STMicroelectronics' price performance through 2025 and into 2026 reflects a company navigating a protracted semiconductor downcycle, with revenue declining from a 2023 peak of approximately $17.3 billion to an estimated $11.8 billion in 2025, according to S&P Global Ratings. A sequential recovery emerged in the second half of 2025, supported by the winding down of customer inventory corrections across automotive and industrial channels, and Q4 2025 revenue of $3.33 billion came in marginally ahead of the $3.29 billion analyst consensus, according to Reuters. That said, an ongoing European manufacturing restructuring continues to weigh on near-term margins, with STM itself warning that restructuring costs will persist through 2026 and that efficiency gains are largely back-loaded toward 2027–2028.
The recovery thesis rests on normalising end-market demand, new microcontroller product launches targeting AI applications, and a targeted approximately $500 million in data centre and optical revenue for 2026. However, those potential tailwinds are offset by risks including weak automotive demand, a beta of 2.0 indicating above-average share price volatility relative to the broader market, and ongoing tariff uncertainty affecting the wider semiconductor supply chain. S&P Global Ratings affirmed STM's BBB+/A-2 credit rating while revising its outlook to negative, citing weaker cash flow generation.
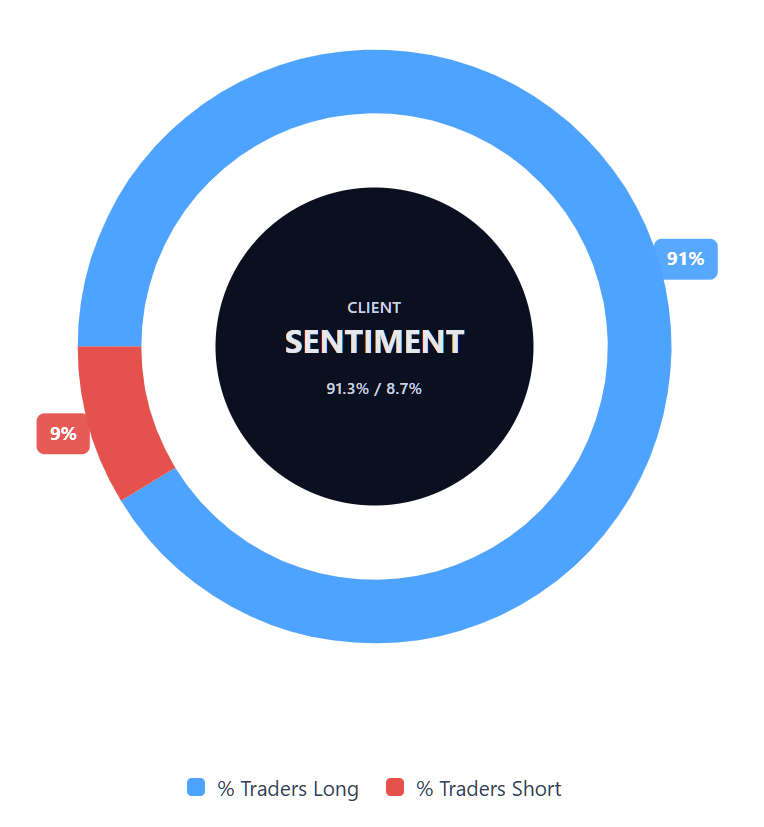
Capital.com’s client sentiment for STMicroelectronics CFDs
As of 8 April 2026, Capital.com client positioning in STMicroelectronics CFDs shows 91.3% buyers vs 8.7% sellers, putting buyers ahead by 82.6 percentage points and placing sentiment firmly in heavy-buy, one-sided territory. This snapshot reflects open positions on Capital.com at the time of writing and is subject to change.
Summary – STMicroelectronics 2026
- STM trades at $32.11 as of 11:24am UTC on 8 April 2026, within an intraday range of $29.97–$32.48, reflecting a sustained retreat from 2023's peak revenue and share price highs.
- TradingView data shows that the 20/50/100/200-day SMAs all carry buy signals, with the 20-over-50 alignment intact, though the average directional index (14) at 14.50 indicates weak trend conviction; the 14-day relative strength index sits at 61.47, in upper-neutral territory.
- Key price drivers include the pace of automotive and industrial semiconductor demand recovery, ongoing European manufacturing restructuring costs weighing on near-term margins, and broader trade tariff uncertainty affecting the wider semiconductor supply chain.
- STM reported Q4 2025 revenue of $3.33 billion, marginally ahead of consensus; Q1 2026 results are due on 23 April 2026, with the company having guided for approximately $3.04 billion in Q1 revenue.
Past performance is not a reliable indicator of future results.
FAQ
Who owns the most STMicroelectronics stock?
What is the 5 year STMicroelectronics share price forecast?
Is STMicroelectronics a good stock to buy?
Could STMicroelectronics stock go up or down?
Should I invest in STMicroelectronics stock?
Can I trade STMicroelectronics CFDs on Capital.com?
Yes, you can trade STMicroelectronics CFDs on Capital.com. Trading share CFDs lets you speculate on price movements without owning the underlying asset and to take long or short positions. However, contracts for difference (CFDs) are traded on margin, and leverage amplifies both profits and losses. You should ensure you understand how CFD trading works, assess your risk tolerance, and recognise that losses can occur quickly.