Solana price prediction: Tariffs and ETF inflows pause
Solana has faced weaker demand since October 2025, with zero net inflows into SOL spot ETFs on 1 April 2026 and the February low of $67.44 remaining a key reference level. Past performance is not a reliable indicator of future results. Explore third-party SOL price targets & technical analysis.
Solana (SOL/USD) is trading at $78.74 in early European trading on 2 April 2026, within an intraday range of $78.69–$85.72. Past performance is not a reliable indicator of future results.
Broader risk-off sentiment is weighing on digital assets amid the continued effect of President Trump's 10% global tariff, introduced under Section 122 in February 2026 after the Supreme Court struck down the original 2025 reciprocal tariff regime (Reuters, 20 February 2026). Trump has also signalled a further rise to 15%, and this has kept pressure on equities and high-beta assets, including cryptocurrencies (Reuters, 21 February 2026). SOL spot ETFs recorded net inflows of zero on 1 April 2026, according to Farside Investors data, reflecting a pause in institutional demand after total 2026 inflows reached approximately $222.49 million (Farside Investors, 2 April 2026).
Solana price prediction 2026-2030: Analyst price target view
As of 2 April 2026, third-party SOL price predictions show a wide dispersion of near-term and full-year targets for SOL, shaped by differing assumptions about Bitcoin cycle timing, on-chain demand recovery, macroeconomic risk appetite, and ETF flow momentum.
Changelly (April 2026 monthly channel)
Changelly places SOL’s April 2026 trading range between a floor of $81.55 and a ceiling of $106.32, with a monthly average near $93.94. The model draws on moving-average signals across the four-hour, daily, and weekly timeframes, noting that the 200-day moving average has been declining since 3 March 2026 and that the 50-day moving average sits above price on all three charts (Changelly, 31 March 2026).
Coin Edition (Fibonacci and ETF-flow scenario analysis)
Coin Edition frames April 2026 around a bull-case target near $100 and a bear-case scenario toward $67.44, contingent on whether the Supertrend support at $79.67 holds on a daily close. The analysis flags that US spot SOL ETFs recorded $6.17M in net outflows on 30 March 2026, pulling total net assets down to $801.91M from a 17 March peak of $936.95M. It adds that three consecutive outflow days have eroded a prior move toward the $1B cumulative inflow milestone (Coin Edition, 31 March 2026).
Coinpedia (2026 annual range framework)
Coinpedia sets a full-year 2026 range of $75–$200 for SOL, with near-term resistance at $97 and key support at $80. The note states that clearing $97 on a sustained basis could open a path toward $110–$116, while a confirmed daily close below $80 would expose the $60 level. This sits within a broader falling-wedge structure that still requires the $97–$116 zone to be flipped to support before any move toward the $180–$200 upper boundary becomes viable (Coinpedia, 1 April 2026).
CoinCodex (algorithmic end-of-year estimate)
CoinCodex models a year-end 2026 price estimate of $108.09 for SOL, with a full-year trading channel of $83.51–$146.18. The algorithm notes that 23 of 29 technical indicators currently signal bearish, the 14-day RSI stands at 43.49 in neutral territory, and the 200-day SMA at $129.57 sits materially above current spot. It also identifies the 50-day SMA at $87 as the first meaningful overhead reference (CoinCodex, 1 April 2026).
Predictions and third-party forecasts are inherently uncertain, as they cannot fully account for unexpected market developments. Past performance is not a reliable indicator of future results.
SOL price: Technical overview
The SOL/USD price trades at $78.74 as of 11:30am UTC on 2 April 2026, with all moving averages on the daily chart aligned in a sell configuration, per TradingView data. The 20-, 50-, 100-, and 200-day simple moving averages sit at approximately $87, $86, $104, and $138 respectively, all above the current price, indicating that spot has broken beneath the full MA stack. The Hull moving average (9) at $80.35 is also above price, adding to the bearish moving-average picture.
Momentum indicators corroborate the subdued tone. The 14-day relative strength index reads 36.96, placing it in lower-neutral territory and approaching, though not yet reaching, conventionally oversold levels. The average directional index at 16.09 suggests that the prevailing trend lacks strong directional conviction at current levels, per TradingView.
To the upside, the classic pivot point at $86.61 represents the first reference above spot; a daily close above that level could bring R1 at $94.21 into view. The 20-day SMA near $87 broadly coincides with that pivot zone, reinforcing it as a key overhead area.
On the downside, the classic S1 at $75.51 is the nearest support reference below the current price, with S2 at $67.91 the next level in focus if S1 fails (TradingView, 2 April 2026).
This is technical analysis for informational purposes only and does not constitute financial advice or a recommendation to buy or sell any instrument.
Solana price history (2024–2026)
SOL/USD’s price traded around $183–$186 in early April 2024, with the broader crypto market in the middle of a post-halving rally. SOL closed 2024 at $189.39, in a year that saw the token more than double from its early-year lows amid recovering institutional appetite and growing on-chain activity.
2025 began strongly, with SOL reaching an intraday high of $295.91 on 19 January 2025 – the peak for this dataset – before retreating sharply. A broad crypto market correction gathered pace through Q1 2025, and by early April 2025 SOL had pulled back to close at $117.69 on 2 April. The token staged a partial recovery into the autumn, climbing back toward the $220–$235 range in early October 2025, before another leg lower took hold. SOL closed 2025 at $124.77, down approximately 34% from its December 2024 year-end close.
The sell-off continued into 2026. SOL hit an intraday low of $67.64 on 6 February 2026 – its weakest level in this two-year dataset – before stabilising in the $78–$97 range through March. SOL is currently trading at $79.13 as of 2 April 2026, approximately 37.7% down year to date and 32.8% down year on year.
Past performance is not a reliable indicator of future results. Share prices are indicative and may differ from live market prices.
Capital.com analyst view: Solana
Solana’s price trajectory over the past two years reflects the broader volatility inherent in the cryptocurrency market. After reaching an intraday high near $295.91 in January 2025, SOL has since declined sharply, trading around $79 as of 2 April 2026 – a level last seen in early 2024. The sell-off has been driven in part by a sustained risk-off environment, with macro headwinds including new US tariff measures and persistent uncertainty around interest rate policy weighing on higher-beta assets. At the same time, continued development within the Solana ecosystem, including growing stablecoin settlement activity and progress on institutional products such as spot ETFs, could provide a supportive counterweight. Equally, any further deterioration in macro conditions or renewed regulatory scrutiny could amplify downside pressure.
Looking ahead, the tension between Solana’s on-chain fundamentals and the current macro backdrop may continue to define price action. Network activity and developer momentum offer a constructive longer-term narrative, while near-term price direction remains sensitive to broader risk appetite, ETF flow trends, and any shifts in US trade or monetary policy – factors that could move sentiment in either direction.
Capital.com’s client sentiment for Solana CFDs
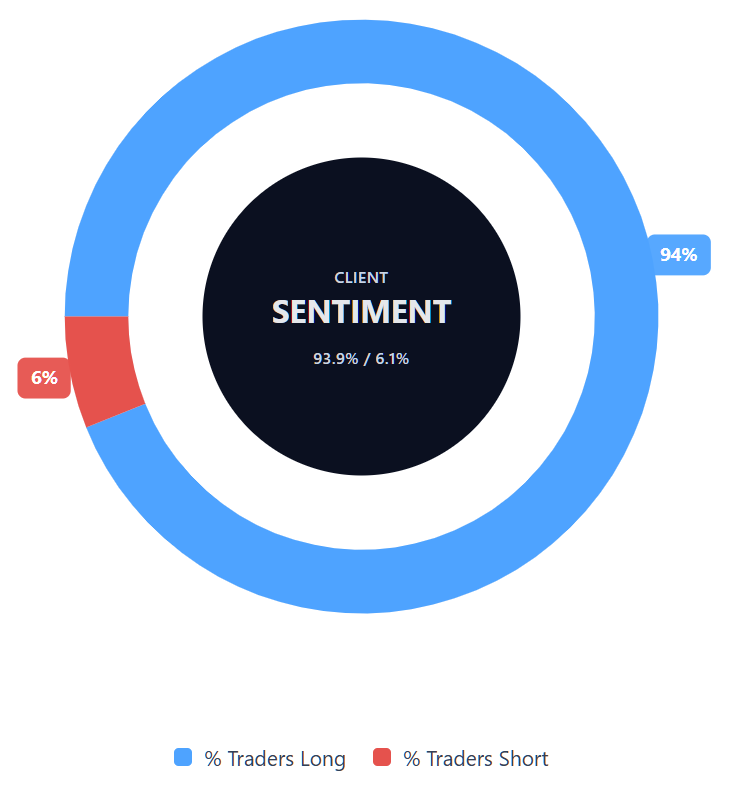
As of 2 April 2026, Capital.com client positioning in Solana CFDs shows 93.9% buyers and 6.1% sellers, putting buyers ahead by 87.8 percentage points and placing sentiment firmly in a heavy-buy, one-sided-toward-longs positioning range. This snapshot reflects open positions on Capital.com and can change.
Summary – Solana (2026)
- As of 11:30am UTC on 2 April 2026, SOL trades at $78.74, down approximately 37.7% year to date and 32.8% year on year, with a two-year high near $295.91 recorded in January 2025.
- Key price drivers include broad risk-off sentiment following President Trump’s new tariff measures announced on 2 April 2026, a pause in US spot SOL ETF inflows, and six consecutive months of negative monthly closes since October 2025.
- Recent developments include a confirmed head-and-shoulders technical breakdown in late March 2026, net ETF outflows of $6.17M on 30 March 2026, and SBI’s B2C2 selecting Solana for stablecoin settlements, reflecting continued ecosystem development alongside near-term market pressure.
Past performance is not a reliable indicator of future results.
FAQ
What is the latest Solana crypto price prediction?
Who owns the most Solana?
How many Solana coins are there?
Could Solana’s price go up or down?
Should I invest in Solana?
Whether Solana is suitable for you depends on your objectives, risk tolerance, time horizon and understanding of the market. Cryptocurrencies are volatile, and the article highlights that forecasts for SOL differ significantly even over short periods. That uncertainty means there is no single answer that suits every trader or investor. It’s usually sensible to do your own research, understand the risks involved and consider seeking independent financial advice before making any investment decision.
Can I trade Solana CFDs on Capital.com?
Yes, you can trade Solana CFDs on Capital.com. Trading crypto CFDs lets you speculate on price movements without owning the underlying asset and to take long or short positions. However, contracts for difference (CFDs) are traded on margin, and leverage amplifies both profits and losses. You should ensure you understand how CFD trading works, assess your risk tolerance, and recognise that losses can occur quickly.