Ethereum price prediction: US–Iran talks, Powell probe dropped
Ethereum is the native token of the Ethereum blockchain, and its price in April 2026 has been shaped by ETF flows, regulatory headlines and broader macro developments. Explore third-party ETH price targets and technical analysis. Past performance is not a reliable indicator of future results.
Ethereum (ETH/USD) is trading at $2,315.05 on the Capital.com platform as of 9:09am UTC on 27 April 2026, within an intraday range of $2,310.16–$2,398.01. Past performance is not a reliable indicator of future results.
Sentiment is shaped by several concurrent developments. A second round of US–Iran nuclear talks scheduled for 27 April 2026 introduces geopolitical uncertainty after a two-week ceasefire extension lifted risk appetite across digital assets earlier in the period (Bloomingbit, 25 April 2026). Meanwhile, the US Department of Justice's decision to drop its investigation into Federal Reserve Chair Jerome Powell, reported on 25 April, has focused market attention on the potential confirmation of pro-crypto Kevin Warsh as the next Fed chair (Yahoo Finance, 25 April 2026). Additionally, the Trump administration's freezing of $344 million in cryptocurrency linked to Iran, disclosed on 24 April, has added a layer of regulatory headline risk to the crypto space (CNN, 24 April 2026), while spot Bitcoin ETFs recorded nine consecutive days of net inflows through 24 April, totalling approximately $2.12 billion, providing a degree of structural support to broader digital-asset markets (FX Leaders, 27 April 2026).
Ethereum price prediction 2026-2030: Analyst price target view
As of 27 April 2026, third-party ETH price predictions reflect a wide divergence of outlooks, shaped by near-term technical models, on-chain data analysis, and longer-dated institutional estimates. The following targets summarise projections from independent sources covering this period.
CoinCodex (short-term technical model)
CoinCodex places ETH at $2,334.91 for 27 April 2026, with the price seen edging towards $2,540.28 by 30 April and $2,594.84 by 1 May. The methodology applies historical price-cycle inputs alongside a neutral RSI reading of 54.71, as of 26 April 2026, as its primary quantitative drivers (CoinCodex, 26 April 2026).
Changelly (30-day rolling forecast)
Changelly sets ETH at $2,317.39 for 27 April 2026, rising towards $2,413.87 by 29 April and $2,521.91 by 30 April, with a December 2026 maximum near $3,249 and an annual average of approximately $2,455. The model, updated on 25 April 2026, draws on technical analysis of historical price cycles, with assumptions of continued ecosystem development and broadly stable macro conditions (Changelly, 25 April 2026).
Coinpedia (cycle-structure and on-chain analysis)
Coinpedia identifies a macro consolidation range for ETH between approximately $2,000 and $4,000, citing structural similarities to previous cycle accumulation zones, and notes $5,000 as a bullish scenario target for 2026. The analysis flags Q1 2026 on-chain transaction volume above 200 million as a multi-year structural reversal in network activity, and identifies a cluster of short liquidations above spot price as a potential upside catalyst, with a 10% move higher estimated to trigger approximately $800 million in short liquidations (Coinpedia, 18 April 2026).
Money Magpie (institutional consensus overview)
Money Magpie cites Standard Chartered as projecting ETH towards approximately $4,000 by end-2026, noting that this represents a revised estimate down from earlier, more aggressive targets. The article frames the forecast within a broader range of conservative technical models that suggest range-bound movement between roughly $2,500 and $4,000, contingent on ETF inflows and macro conditions remaining stable (Money Magpie, 12 April 2026).
CoinGabbar (technical pattern analysis)
CoinGabbar identifies an ascending triangle pattern on the ETH chart, with a flat resistance zone near $2,200 – $2,250 and support around $2,000 – $2,050. The analysis flags a breakout above the $2,250 resistance as the key technical trigger for a potential move towards $4,000, while a failure to hold $2,000 support is cited as the primary downside risk scenario (CoinGabbar, 7 April 2026).
Predictions and third-party forecasts are inherently uncertain, as they cannot fully account for unexpected market developments. Past performance is not a reliable indicator of future results.
ETH price: Technical overview
The ETH/USD price last closed at $2,315.05, trading within a 27 April 2026 intraday range of $2,310.16–$2,398.01, according to the Capital.com quote feed. Price sits just above the 20-day simple moving average (SMA) at around $2,311 and the volume-weighted moving average at around $2,316. It also trades above the 100-day SMA at around $2,231, though it remains below the 10-day SMA at around $2,329. The 100-day SMA therefore sits below spot, offering a nearby floor rather than overhead resistance.
The 14-day relative strength index reads 53.5, a neutral reading that suggests momentum is neither extended nor depleted. The average directional index, at 24.6, approaches the 25 threshold that TradingView associates with an established trend, but it has not yet confirmed one, indicating that the prevailing move lacks strong directional conviction at this stage.
To the upside, the classic R1 pivot at $2,357 is the nearest reference above current price; a daily close through that level would put the R2 zone near $2,610.6 in view over a longer horizon. On pullbacks, the classic pivot point at $2,132.4 represents the initial support reference, with the 100-day SMA shelf near $2,231 acting as an intermediate level. A sustained move beneath the pivot would bring S1 near $1,878.7 into consideration (TradingView, 27 April 2026).
This is technical analysis for informational purposes only and does not constitute financial advice or a recommendation to buy or sell any instrument.
Ethereum price history (2024–2026)
ETH/USD’s price opened April 2024 near $3,266, trading broadly sideways through mid-year before slipping back towards the $2,300–$2,400 range through August and September 2024. A sustained rally into year-end pushed ETH to a 2024 close of $3,331.81.
2025 opened with ETH above $3,350 and briefly tested $3,368 in mid-January before a prolonged decline dragged it to a multi-month low of $1,389.79 on 9 April 2025, as broader risk-off pressure weighed on crypto markets. A sharp recovery followed, with ETH climbing back through $2,200 by early May and extending gains into the autumn. It reached a two-year intraday high of $3,659.31 on 10 November 2025, fuelled by renewed institutional and retail interest across digital assets.
ETH closed 2025 at $2,967.68, then opened 2026 above $3,000, reaching $3,368.27 intraday on 18 January before reversing sharply. A sell-off through February and March pulled prices back below $2,000 by late March, with ETH finding a floor near $1,908 before recovering.
ETH closed at $2,316.39 on 27 April 2026, approximately 22.8% down year to date, but 29.2% up year on year.
Past performance is not a reliable indicator of future results. Prices are indicative and may differ from live market prices.
Capital.com analyst view: Ethereum
Ethereum's price trajectory over the past year reflects the tension between strong network fundamentals and persistent macroeconomic headwinds. ETH climbed from below $1,800 in April 2025 to a two-year intraday high above $3,659 in November 2025, supported by growing institutional interest in digital assets, the broader Bitcoin halving cycle, and increased developer activity. However, that same sensitivity to risk sentiment has also worked in the other direction: ETH shed roughly 37% from its January 2026 high of $3,368 to current levels near $2,315, as global trade uncertainty and a broader equity sell-off weighed on speculative assets. The Pectra network upgrade, while noted as a potential catalyst for improved staking efficiency and transaction capacity, also introduces execution risk. Delays or technical setbacks could dampen confidence in the near term.
The regulatory backdrop adds further nuance. The DOJ's decision to drop its investigation into the Federal Reserve chair, and the prospect of a more crypto-friendly successor, may reduce institutional friction for digital-asset exposure. Conversely, the US government's freezing of $344 million in crypto linked to Iran in April 2026 is a reminder that regulatory intervention remains an active variable and can affect sentiment quickly. Ethereum's dual role as a network utility token and a speculative asset means its price can respond sharply to both technological progress and policy shifts, in either direction.
Capital.com’s client sentiment for Ethereum CFDs
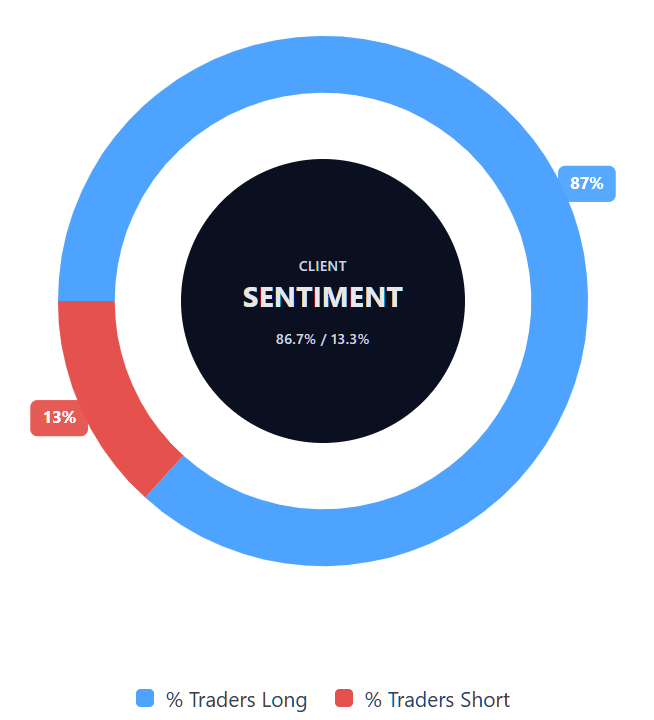
As of 27 April 2026, Capital.com client positioning in Ethereum CFDs stands at 86.7% long and 13.3% short, which puts buyers ahead by 73.5 percentage points and places sentiment firmly in a heavy-buy, one-sided-towards-longs territory. This snapshot reflects open positions on Capital.com and can change.
Summary – Ethereum (2026)
- As of 9:09am UTC on 27 April 2026, ETH last closed at $2,315.05 on Capital.com, approximately 22.8% down year to date but 29.2% higher year on year, after trading between roughly $1,390 and $3,659 over the past two years.
- TradingView indicators show a mixed picture: the 14-day RSI reads 53.5 (neutral), the MACD and momentum oscillators are in sell territory, and price sits just above the 20-day SMA near $2,311, while the 100-day SMA remains below spot.
- Key drivers include ongoing US–Iran nuclear talks, the DOJ's decision to drop its investigation into the Fed chair, and the potential confirmation of a more crypto-friendly successor, all of which have shaped sentiment in April 2026.
- The US government's freezing of $344 million in crypto linked to Iran adds a regulatory risk variable, while nine consecutive days of spot Bitcoin ETF net inflows totalling around $2.12 billion through late April have provided broader digital-asset support.
- Ethereum's Pectra network upgrade, aimed at improving staking efficiency and transaction capacity, has been cited as a potential catalyst; spot Ethereum ETFs, however, recorded five consecutive months of outflows entering April 2026.
Past performance is not a reliable indicator of future results.
FAQ
What is the latest Ethereum crypto price prediction?
Who owns the most Ethereum?
How much ether is there?
Ether does not have a fixed maximum supply in the same way as some other cryptocurrencies. Instead, Ethereum’s supply changes over time through issuance to validators and the burning of part of transaction fees under the network’s fee mechanism. As a result, the amount of ETH in circulation can rise or fall depending on network activity and protocol conditions. When assessing supply, it’s usually more useful to look at current circulating supply than assume a hard cap exists.
Could Ethereum’s price go up or down?
Should I invest in Ethereum?
Can I trade Ethereum CFDs on Capital.com?
Yes, you can trade Ethereum CFDs on Capital.com. Trading crypto CFDs lets you speculate on price movements without owning the underlying asset and to take long or short positions. However, contracts for difference (CFDs) are traded on margin, and leverage amplifies both profits and losses. You should ensure you understand how CFD trading works, assess your risk tolerance, and recognise that losses can occur quickly.