Bitcoin price prediction: BlackRock IBIT leads ETF inflows
Bitcoin traded near $77,700 on 27 April 2026 after US spot Bitcoin ETF inflows accelerated, with BlackRock's IBIT leading daily flows and broader macro conditions also affecting price. Explore third-party BTC price targets. Past performance is not a reliable indicator of future results.
Bitcoin (BTC/USD) last traded at $77,699.05 on Capital.com's quote feed, moving within a session range of $77,398.10–$79,385.40 in early Monday trading at 10:26am UTC on 27 April 2026. Past performance is not a reliable indicator of future results.
Price has been supported by a sustained wave of institutional inflows into US spot Bitcoin exchange-traded funds (ETFs), with SoSoValue data showing that 12 spot Bitcoin ETFs recorded $335.8 million in net inflows on 22 April alone (Yahoo Finance, 23 April 2026). BlackRock's iShares Bitcoin Trust (IBIT) led that session with $246.9 million and has accumulated roughly $3 billion in recent inflows, placing it in the top 1% of all ETF products by flow (FX Leaders, 23 April 2026). The broader macro backdrop also contributed, as the reopening of the Strait of Hormuz to commercial shipping following an Iran ceasefire announcement on 17 April eased energy supply concerns, reduced oil-price pressure and improved appetite for risk assets, including crypto (FinanceFeeds, 22 April 2026). The US Dollar Index (DXY) was last recorded at 98.53 on 24 April, according to MacroMicro data, while a JPMorgan analysis published in March 2026 noted that Bitcoin's correlation with the dollar had shifted, complicating the traditional inverse relationship that once acted as a straightforward macro headwind (OSL, 25 April 2026).
Bitcoin price outlook: ETF inflows meet key BTC resistance
As of 27 April 2026, third-party BTC price predictions reflect a wide divergence of views, shaped by institutional demand, macroeconomic conditions, post-halving cycle dynamics, and ongoing regulatory developments. The following targets summarise leading expert projections for BTC in the current market environment.
CoinCodex (algorithmic year-end range)
CoinCodex projects BTC will trade within a range of $75,177–$92,823 for 2026, with an end-of-year central estimate of $75,653. The model cites current consolidation in the $75,000–$80,000 zone as the key near-term structure, with upside conditional on a sustained breakout above $80,000 (CoinCodex, 26 April 2026).
Yahoo Finance (Peter Brandt cycle view)
Veteran trader Peter Brandt anticipates an 'investable low' for BTC in September or October 2026, which may or may not breach the February 2026 lows near $60,000, ahead of a major cyclical recovery. The thesis rests on historical cycle timing and chart structure rather than fundamental catalysts (Yahoo Finance, 25 April 2026).
Coinpedia (full-year range)
Coinpedia sets a 2026 forecast range of $100,000–$180,000, with a potential average near $150,000, as it views current price action in the $70,000–$80,000 zone as an accumulation phase rather than distribution. The publication notes that a decisive reclaim of $80,000–$90,000 would be the first trigger for expansion towards $100,000–$110,000, while failure to hold $67,000 support could expose $60,000–$62,000 (Coinpedia, 25 April 2026).
CoinGecko (Q1 2026 industry report)
CoinGecko's Q1 2026 Crypto Industry Report notes that total crypto market capitalisation fell 20.4% during the quarter to $2.4 trillion, leaving the market approximately 45% below its October 2025 peak and providing the macro context against which current BTC forecasts should be assessed. The report frames the Q1 drawdown as a sharp correction that shifted market sentiment towards a 'crypto winter' narrative, though it describes overall market sentiment heading into Q2 as cautiously bullish (CoinGecko, 16 April 2026).
Yahoo Finance / Deutsche Bank (consumer survey)
A Deutsche Bank consumer survey reported by Yahoo Finance found that a majority of respondents did not expect a Bitcoin price recovery in 2026. In the US, 19% place year-end BTC between $20,000 and $60,000, while 13% anticipate a fall below $20,000. The survey, conducted against a backdrop of BTC hovering near $77,000 at the time of publication, highlights the gap between retail sentiment and current market prices (Yahoo Finance, 20 April 2026).
Predictions and third-party forecasts are inherently uncertain, as they cannot fully account for unexpected market developments. Past performance is not a reliable indicator of future results.
BTC price: Technical overview
The BTC/USD price last closed at $77,699.05, trading within a session range of $77,398.10–$79,385.40 as of 10:26am UTC on 27 April 2026. On the daily chart, price holds above a broad moving-average cluster, with the 20/50/100/200-day SMAs standing at approximately $75,259 / $71,813 / $72,978 / $84,757. The 20-over-50 alignment remains intact across both the simple and exponential families, a configuration that TradingView's moving-average summary characterises as a buy signal across tenors from 10 to 100 days. The 200-day SMA near $84,757 and its exponential counterpart near $82,425 both sit above the last close and register as sell signals, indicating that BTC has not yet reclaimed its longer-term trend level.
Momentum is broadly constructive but not stretched. The 14-day relative strength index reads 61, placing it in the upper-neutral range, while the average directional index at 26 suggests an established, though not strong, trend is in place, according to TradingView data.
On the topside, the classic R1 pivot near $74,500 has already been cleared. The next reference point is R2 at $80,786, with a sustained daily close above that level bringing R3 near $91,844 into broader view. On pullbacks, the classic pivot point at $69,728 marks initial support, followed by the 100-day SMA shelf near $72,978. A move below that level would bring S1 near $63,442 into focus (TradingView, 27 April 2026).
This is technical analysis for informational purposes only and does not constitute financial advice or a recommendation to buy or sell any instrument.
Bitcoin price history (2024–2026)
BTC/USD’s price opened April 2024 near $63,000, then dipped towards $57,000 before surging to a then-record high above $73,000 in mid-March 2024, driven in part by optimism around the approval of US spot Bitcoin ETFs earlier that year. A post-halving correction pulled the price back into the $55,000–$65,000 range over the summer, though BTC later found support and recovered through the autumn.
The strongest advance came in Q4 2024. Donald Trump's election victory in November 2024 coincided with a sharp rally that carried BTC through $76,000–$99,000 in the space of a few weeks, with the coin closing the year near $87,500 and briefly approaching the $100,000 mark.
2025 opened with BTC in the mid-$90,000s. Prices climbed above $107,000 between May and July 2025, then held broadly in the $108,000–$120,000 range through summer and into autumn. A pullback began in Q4 and accelerated in early 2026 amid renewed macro uncertainty and tariff concerns, with BTC sliding from around $97,000 at the turn of the year towards the $65,000–$68,000 range by late March 2026.
BTC closed at $77,747.15 on 27 April 2026, approximately 11.1% down year to date and 17.1% lower year on year.
Past performance is not a reliable indicator of future results. Prices are indicative and may differ from live market prices.
Capital.com analyst view: Bitcoin
Bitcoin's price trajectory over the past two years reflects the asset's tendency to move through sharp, sentiment-driven cycles. The rally from $63,000 in early 2024 to highs above $107,000 in mid-2025 was underpinned by structural catalysts, most notably the launch of US spot Bitcoin ETFs and a post-halving supply reduction, which drew sustained institutional participation. However, the subsequent retreat towards the $65,000–$78,000 range in early 2026 illustrates how quickly those same flows can reverse when macro conditions shift, as tariff uncertainty and broader risk-off sentiment weighed on speculative assets.
In the current market, renewed ETF inflows and a softer US dollar have supported a partial recovery towards the $78,000 area, and BTC's 20-over-50-day moving-average alignment remains constructive on the daily chart. That said, the 200-day simple moving average near $84,757 continues to act as overhead resistance, and the asset remains sensitive to macro developments, regulatory headlines, and shifts in risk appetite. Those factors could either extend or disrupt the current rebound. Past performance is not a reliable indicator of future results.
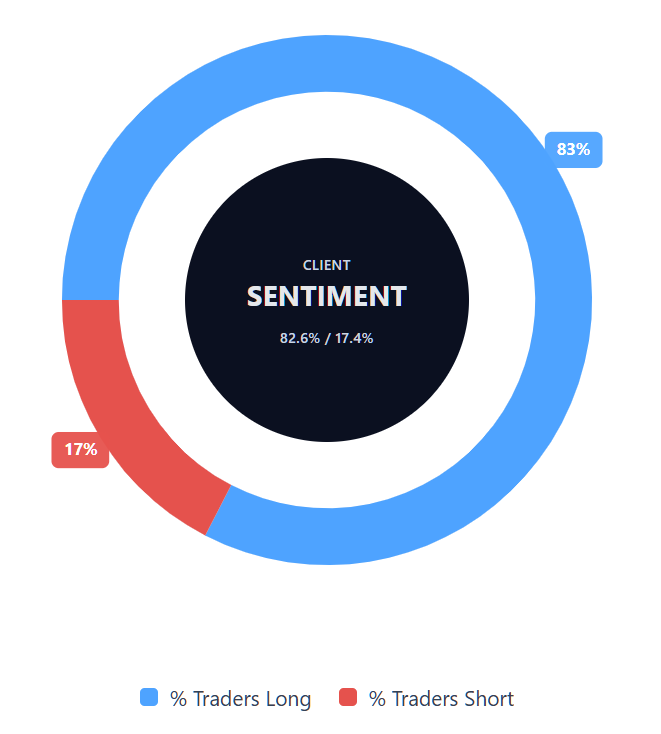
Capital.com’s client sentiment for Bitcoin CFDs
As of 27 April 2026, Capital.com client positioning in Bitcoin CFDs shows 82.6% buyers versus 17.4% sellers, putting buyers ahead by 65.2 percentage points and placing sentiment firmly in long-skewed territory. This snapshot reflects open positions on Capital.com and can change rapidly as market conditions evolve.
Summary – Bitcoin (2026)
- BTC last closed at $77,747.15 on 27 April 2026, down roughly 11% year to date and 17% year on year, after peaking above $107,000 in mid-2025.
- Key price drivers include US spot Bitcoin ETF inflows led by BlackRock's IBIT, US dollar weakness, post-halving supply dynamics, and broader macro sentiment around trade policy and risk appetite.
- Recent developments include BlackRock's IBIT accumulating approximately $3 billion in recent inflows, a Deutsche Bank survey showing mixed retail confidence in a 2026 recovery, and easing geopolitical tensions following an Iran ceasefire in April.
Past performance is not a reliable indicator of future results.
FAQ
What is the latest Bitcoin crypto price prediction?
Who owns the most Bitcoin?
How much BTC is there?
Could Bitcoin’s price go up or down?
Should I invest in Bitcoin?
Can I trade Bitcoin CFDs on Capital.com?
Yes, you can trade Bitcoin CFDs on Capital.com. Trading crypto CFDs lets you speculate on price movements without owning the underlying asset and to take long or short positions. However, contracts for difference (CFDs) are traded on margin, and leverage amplifies both profits and losses. You should ensure you understand how CFD trading works, assess your risk tolerance, and recognise that losses can occur quickly.