Ethereum price prediction: ETF outflows and macro risk
Ethereum is a decentralised blockchain network and cryptocurrency trading near $2,000, with digital assets pressured by ETF outflows and macro risk. Explore third-party ETH price targets and technical analysis. Past performance is not a reliable indicator of future results.
Ethereum (ETH/USD) is trading at $1,972.85 as of 1:41pm UTC on 2 June 2026, within an intraday range of $1,960.20–$2,014. Past performance is not a reliable indicator of future results.
Digital assets remain broadly under pressure as institutional outflows and geopolitical uncertainty weigh on risk appetite. Bitcoin fell to around $70,200, its lowest level in more than seven weeks, while spot Bitcoin ETF net outflows totalled approximately $401.62 million in May, the third-largest monthly withdrawal since late 2025. Macro conditions add a further headwind. The US ISM Manufacturing Prices Paid component remained above 80 for a second consecutive month in May, underscoring sticky inflation and keeping Federal Reserve expectations in focus ahead of Friday's nonfarm payrolls report. The 10-year US Treasury yield was around 4.43% in early Tuesday trading. Middle East tensions also remain a live driver after Iran reportedly halted contacts with Washington following Israeli strikes in Lebanon, raising concerns over the Strait of Hormuz and sustaining elevated crude oil prices, which can affect broader risk sentiment (Saxo Bank, 2 June 2026).
ETF outflows and macro pressure shape third-party Ethereum forecasts
As of 2 June 2026, third-party ETH price predictions reflect a broad range of outlooks shaped by on-chain activity, institutional flows, network upgrade progress, and macroeconomic conditions.
CoinCodex (algorithmic monthly range)
CoinCodex places ETH within a June 2026 trading channel of $1,965 – $2,361, with a monthly average of $2,175 and a 1-month upper target of $2,361 as of 1 June 2026. The model, which weights Bitcoin halving cyclicality and historical volatility, registers bearish near-term sentiment, with 28 of 33 technical indicators signalling caution. The 14-day RSI sits at 31.68, near oversold territory, while the year-end 2026 target is placed at $2,378 (CoinCodex, 1 June 2026).
Changelly (monthly technical model)
Changelly projects a June 2026 floor of $1,972, an average of $2,288, and a monthly ceiling of $2,370, with a near-term 4-day target of $2,060 by 4 June 2026. The forecast draws on technical price indicators and notes a full-year 2026 minimum of $2,207 and maximum of $2,370, with the annual average expected around $2,288 amid continued macroeconomic uncertainty (Changelly, 31 May 2026).
Coinpedia (cycle structure view)
Coinpedia places ETH's 2026 high at $6,100, citing the Pectra and Fusaka network upgrades and rising real-world asset tokenisation on the network, which reached $17.9 billion in TVL across 145 active Layer 2 protocols as of Q1 2026. The analysis flags a near-term recovery target of $2,878 as an initial hurdle, with the $6,100 upside scenario contingent on mega-whale sellers shifting back to accumulation amid a tightening exchange supply (Coinpedia, 25 May 2026).
CoinGecko (institutional consensus overview)
CoinGecko summarises institutional targets for 2026 as ranging from Citi's cautious $3,175, citing stalled US crypto market-structure legislation and weakening on-chain user metrics, to Standard Chartered's $7,500 year-end call, with Fundstrat's internal research placing a year-end figure at $4,500. The overview notes that Fundstrat's internal H1 2026 range of $1,800 – $2,000 has largely been realised, while the wider spread of institutional targets reflects ongoing uncertainty over ETF net flows, Layer 2 fee-revenue cannibalisation, and the pace of stablecoin market expansion toward a projected $2 trillion by 2028 (CoinGecko, 13 April 2026).
Saxo Bank (macro cross-asset context)
Saxo Bank notes that digital assets remain under broad macro pressure as of 2 June 2026, with Bitcoin retreating toward $70,200 and risk appetite constrained by sticky US inflation. The ISM Manufacturing Prices Paid component held above 80 for a second consecutive month in May, while Middle East tensions kept crude oil prices elevated. The backdrop keeps near-term crypto sentiment fragile, as the 10-year US Treasury yield held around 4.43% in early Tuesday trading, limiting demand for higher-risk assets such as ETH (Saxo Bank, 2 June 2026).
Predictions and third-party forecasts are inherently uncertain, as they cannot fully account for unexpected market developments. Past performance is not a reliable indicator of future results.
Ethereum: key macro context
Broader macroeconomic conditions as of 2 June 2026 are weighing on risk assets including ETH, with US inflation remaining elevated. The ISM Manufacturing Prices Paid index held above 80 for a second consecutive month in May 2026, reinforcing expectations that the Federal Reserve will maintain a cautious stance on rate cuts. The 10-year US Treasury yield sat at approximately 4.43% in early Tuesday trading (Saxo Bank, 2 June 2026).
Geopolitical risk continues to add to the uncertain backdrop. Iran reportedly halted diplomatic contacts with Washington following Israeli strikes in Lebanon, raising concerns over Strait of Hormuz supply disruption and keeping crude oil prices elevated (Saxo Bank, 2 June 2026). Elevated energy costs can contribute to broader inflationary pressure, which in turn may limit appetite for higher-risk assets such as ETH during periods of risk-off sentiment.
Institutional crypto flows also remain a near-term headwind. Spot Bitcoin ETF net outflows totalled approximately $401.62 million across May 2026, the third-largest monthly withdrawal since late 2025, with IBIT declining 2.7% on 1 June alone. This signalled persistent softness in institutional demand, which has affected the broader digital asset market, including Ethereum (BeinCrypto, 28 May 2026). Friday's US nonfarm payrolls report is the next scheduled macro data release with potential to shift sentiment; a materially weaker reading could prompt renewed Federal Reserve rate-cut expectations and support risk appetite (Saxo Bank, 2 June 2026).
ETH price: technical overview
The ETH/USD price trades at $1,972.85 as of 1:41pm UTC on 2 June 2026, below its full moving-average stack, according to TradingView data. The 20/50/100/200-day SMAs sit at approximately $2,091/$2,230/$2,159/$2,486, all above current spot. At this level, no same-family MA pair shows a bullish alignment. The Hull moving average (9), at $1,985.50, is the only moving-average reference trading near spot.
Momentum indicators reflect broad selling pressure. The 14-day RSI sits at 28.80, a level associated with oversold conditions, while the ADX (14) reads 38.20, indicating an established and active trend rather than a directionless drift, per TradingView.
To the upside, the classic R1 pivot at $2,297 is the nearest reference above spot. A daily close above that level would bring R2 near $2,590 into view. On the downside, the classic pivot point (P) at $2,131 now acts as overhead resistance. Initial support from the classic S1 sits at $1,837, with S2 near $1,671 the next reference should S1 give way (TradingView, 2 June 2026).
This technical analysis is for informational purposes only and does not constitute financial advice or a recommendation to buy or sell any instrument.
Ethereum price history (2024–2026)
ETH/USD’s price reached an all-time high of $4,954 in August 2025, supported by a post-halving crypto rally, growing institutional interest, and the approval of spot ETH ETFs in the United States.
ETH entered 2026 above $3,300 but began retreating as spot ETH ETF outflows mounted and macroeconomic conditions tightened. By early May 2026, prices had slipped to around $2,292, with the token shedding more than half its August 2025 peak value amid persistent inflation data and risk-off sentiment across global markets.
A brief recovery mid-month pushed ETH back toward $2,384 on 10 May, before sellers reasserted control. The token closed May at $2,005, capping a month in which it fell approximately 12.6% — the largest monthly decline since late 2024. Heavy ETF outflows, totalling roughly $401.62m across May, coincided with the sell-off.
ETH is trading at $1,972.85 on 2 June 2026, approximately 40.4% below its August 2025 all-time high and down roughly 12.8% year to date.
Past performance is not a reliable indicator of future results. Prices are indicative and may differ from live market prices.
Capital.com analyst view: Ethereum
Ethereum’s price narrative in 2025–2026 reflects the tension between strong network fundamentals and a challenging macro and sentiment backdrop. The Pectra upgrade, completed in mid-2025, raised the validator staking limit from 32 ETH to 2,048 ETH and improved network efficiency, while real-world asset tokenisation on the network reached $17.90bn in TVL across 145 active Layer 2 protocols as of Q1 2026. These structural developments support the view that Ethereum retains a credible role as a global settlement layer. However, ETH has also fallen approximately 40% from its August 2025 all-time high near $4,954, weighed down by persistent spot ETF outflows, sticky US inflation, and Solana’s developer base growing 42% in 2025, which has intensified competition for users and capital.
The near-term picture carries competing signals. Two further upgrades, Glamsterdam and Hegotá, are scheduled for the first and second halves of 2026 respectively, targeting MEV fairness and throughput improvements that could attract renewed institutional interest if delivered on schedule. Against that, low gas fees since the Dencun upgrade have reduced ETH fee-burning, weakening the deflationary dynamic that supported earlier rallies. Macroeconomic tightening also continues to limit risk appetite broadly. Both threads warrant monitoring as conditions evolve.
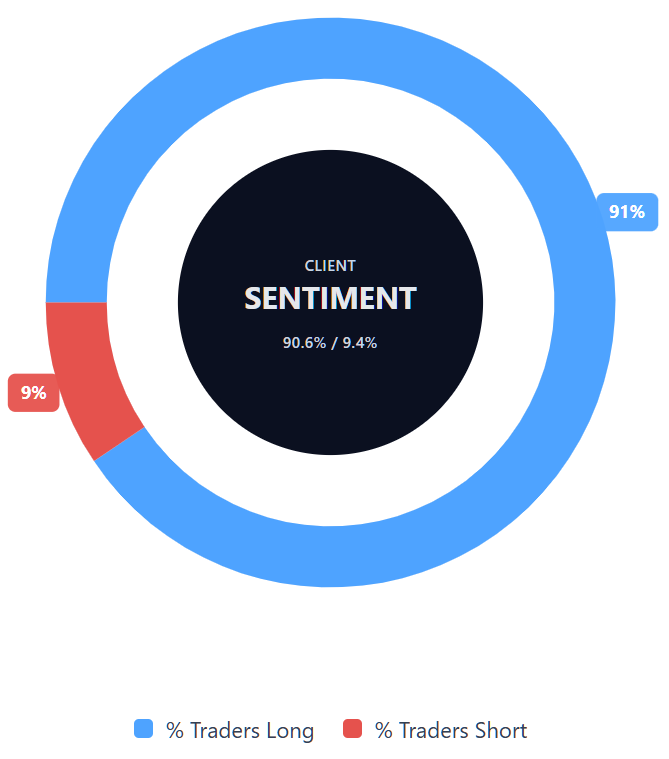
Capital.com’s client sentiment for Ethereum CFDs
As of 2 June 2026, Capital.com client positioning in Ethereum CFDs shows 90.6% buyers vs 9.4% sellers, putting buyers ahead by 81.2 percentage points and indicating a strong long-side bias among open positions. This snapshot reflects open positions on Capital.com and can change.
Summary – Ethereum (2026)
- As of 1:41pm UTC on 2 June 2026, ETH trades at $1,972.85, down roughly 40% from its August 2025 all-time high near $4,954 and approximately 12.8% year to date.
- Key drivers include persistent spot ETH ETF outflows, with approximately $401.62m recorded in May 2026, sticky US inflation with ISM Prices Paid above 80, a 10-year Treasury yield near 4.43%, and elevated geopolitical risk.
- The completed Pectra upgrade and two further 2026 upgrades, Glamsterdam and Hegotá, represent potential network catalysts. Growing Layer 2 competition and reduced fee-burning remain structural headwinds.
Past performance is not a reliable indicator of future results.
FAQ
What is the latest Ethereum crypto price prediction?
As of 2 June 2026, third-party Ethereum forecasts show a wide range of possible outcomes. Model-based near-term projections for June cluster around $1,965–$2,361, while institutional year-end targets range from $3,175–$7,500. This spread reflects uncertainty around ETF flows, network upgrades, regulation, macroeconomic conditions and broader risk appetite. Forecasts can change quickly and shouldn’t be treated as guarantees of future price performance.
Who owns the most Ethereum?
Ethereum ownership is spread across individual wallets, exchanges, staking contracts, institutional holders and decentralised finance protocols. The largest visible holdings are typically associated with smart contracts, staking infrastructure or exchange-linked wallets rather than clearly identifiable individuals. Because blockchain addresses don’t always reveal the beneficial owner, it’s difficult to say who owns the most Ethereum with certainty. Concentrated holdings can still influence market liquidity, particularly if large holders move funds onto or off exchanges.
How many Ethereum coins are there?
Ethereum doesn’t have a fixed maximum supply in the same way as bitcoin. The amount of ETH in circulation changes over time as new ETH is issued through staking rewards and some ETH is removed from circulation through fee-burning. Lower network fees can reduce the amount of ETH burned, which may weaken deflationary pressure. Supply dynamics are one of several factors traders may monitor, alongside network activity, demand, macro conditions and institutional flows.
Could Ethereum’s price go up or down?
Yes. Ethereum’s price can move in either direction, and often reacts to a mix of crypto-specific and macroeconomic factors. Potential upside drivers include stronger network activity, successful upgrades, improving ETF flows, clearer regulation and stronger risk appetite. Downside risks include persistent outflows, higher bond yields, sticky inflation, geopolitical uncertainty, weaker on-chain activity and competition from other networks. Because ETH is volatile, price forecasts should be read as scenarios rather than predictions.
Should I invest in Ethereum?
Whether Ethereum is suitable depends on your financial goals, risk tolerance, experience and time horizon. Ethereum is a volatile digital asset, and trading or investing in it can result in losses. Before making any decision, consider the risks, research the market, and think about whether you understand what can move the price. This article is for informational purposes only and doesn’t constitute financial advice or a recommendation to buy or sell ETH.
Can I trade Ethereum CFDs on Capital.com?
Yes, you can trade Ethereum CFDs on Capital.com. Trading crypto CFDs lets you speculate on price movements without owning the underlying asset and to take long or short positions. However, contracts for difference (CFDs) are traded on margin, and leverage amplifies both profits and losses. You should ensure you understand how CFD trading works, assess your risk tolerance, and recognise that losses can occur quickly.