
Ethereum price prediction: Post-Merge ETH recovering
Can ETH continue to regain its losses after a poor year?
Hopes that Ethereum (ETH) would thrive after its transition from a proof-of-work (PoW) to the proof-of-stake (PoS) consensus mechanism were dashed, at least for the time being, with the coin falling 25% in the three months from the date of The Merge to the start of 2023 and only breaking past the price levels it set around the time of the changeover six months later.
Following the Shapella hard fork of 12 April 2023, ETH's price threatened to break past $2,000 for the first time since May 2022, but, mindful of the post-Merge slump, the impact the change will have on the coin's price remains to be seen.
In November 2022, ETH was hit by the market crash triggered by the collapse into bankruptcy of the FTX (FTT) exchange, after a planned takeover by Binance (BNB) and its subsequent cancellation.
The news saw ETH plunge from a daily high of $1,574.80 on 8 November 2022 to a low of $1,083.29 the following day, before making a recovery to trade at a high of $1,346.17 on 14 December. It then fell to trade at around $1,207.49 on 3 January before a bouyant market saw it reach $1,732.80 on 15 February 2023.
On 24 November 2022, proposals to put in a hard fork first called Shanghai, and then renamed Shanghai/Capella, or Shapella for short were approved, with the new version of the updated blockchain potentially featuring the ability to withdraw staked crypto as well as helping to speed up the system. Shapella will go live on 12 April 2023.
ETH had struggled after the switch to PoS – known as “The Merge”, part of the so-called Ethereum 2.0 upgrade – on 15 September 2022, with the price of ETH falling from $1,635 to a low of $1,209.28 on 13 October 2022 as the crypto struggled in tough market conditions.
However, news that Google (GOOGL) was launching a blockchain node hosting service, based on its cloud service and initially compatible with the Ethereum blockchain, helped the coin recover, and it broke past the $1,500 mark for the first time since the day of The Merge on 25 October 2022.
The Ethereum blockchain’s founder, Vitalik Buterin, then announced a new roadmap for the crypto, including a phase called The Scourge, designed to solve issues with the amount of ETH that could be extracted whenever a block was added to the blockchain, which contributed to it reaching a high of $1,661.33 on 4 November 2022, before the market collapsed.
ETH to USD

The transition from PoW to PoS has changed the way the Ethereum blockchain verifies transactions. Rather than using miners who consume vast amounts of computing power to validate and create new blocks, block validators now stake their capital in the form of native ether (ETH) coins, which are held as collateral in a staking pool against them behaving dishonestly or being lazy. The PoS process dramatically reduces energy consumption.
PoS will also improve the economics of the Ethereum blockchain, as under PoW, Ethereum issued 5.4 million ETH to miners annually, but it will only issue around 500,000 ETH as payment to stakers. This could reduce inflation and could see ether become deflationary, as a portion of the fees for each transaction will be burned, reducing the coin’s overall supply.
That could have an impact on the ethereum coin price prediction.
The Merge should not have any other impact on ETH holders. It is not expected to affect tokens or smart contracts running on the blockchain. Decentralised applications (dApps) should function as before.
The Merge should not significantly increase Ethereum’s scalability, as the introduction of shards, which split a blockchain into smaller sections, should take place this year.
When sharding is complete, it will supercharge the speed of ETH, allowing 100,000 transactions a second, up from the current level of just 25. It will also cut gas fees, making transactions much cheaper.
The Merge took place on the morning of 15 September 2022.
ETH price around The Merge
Credit: CoinMarketCap
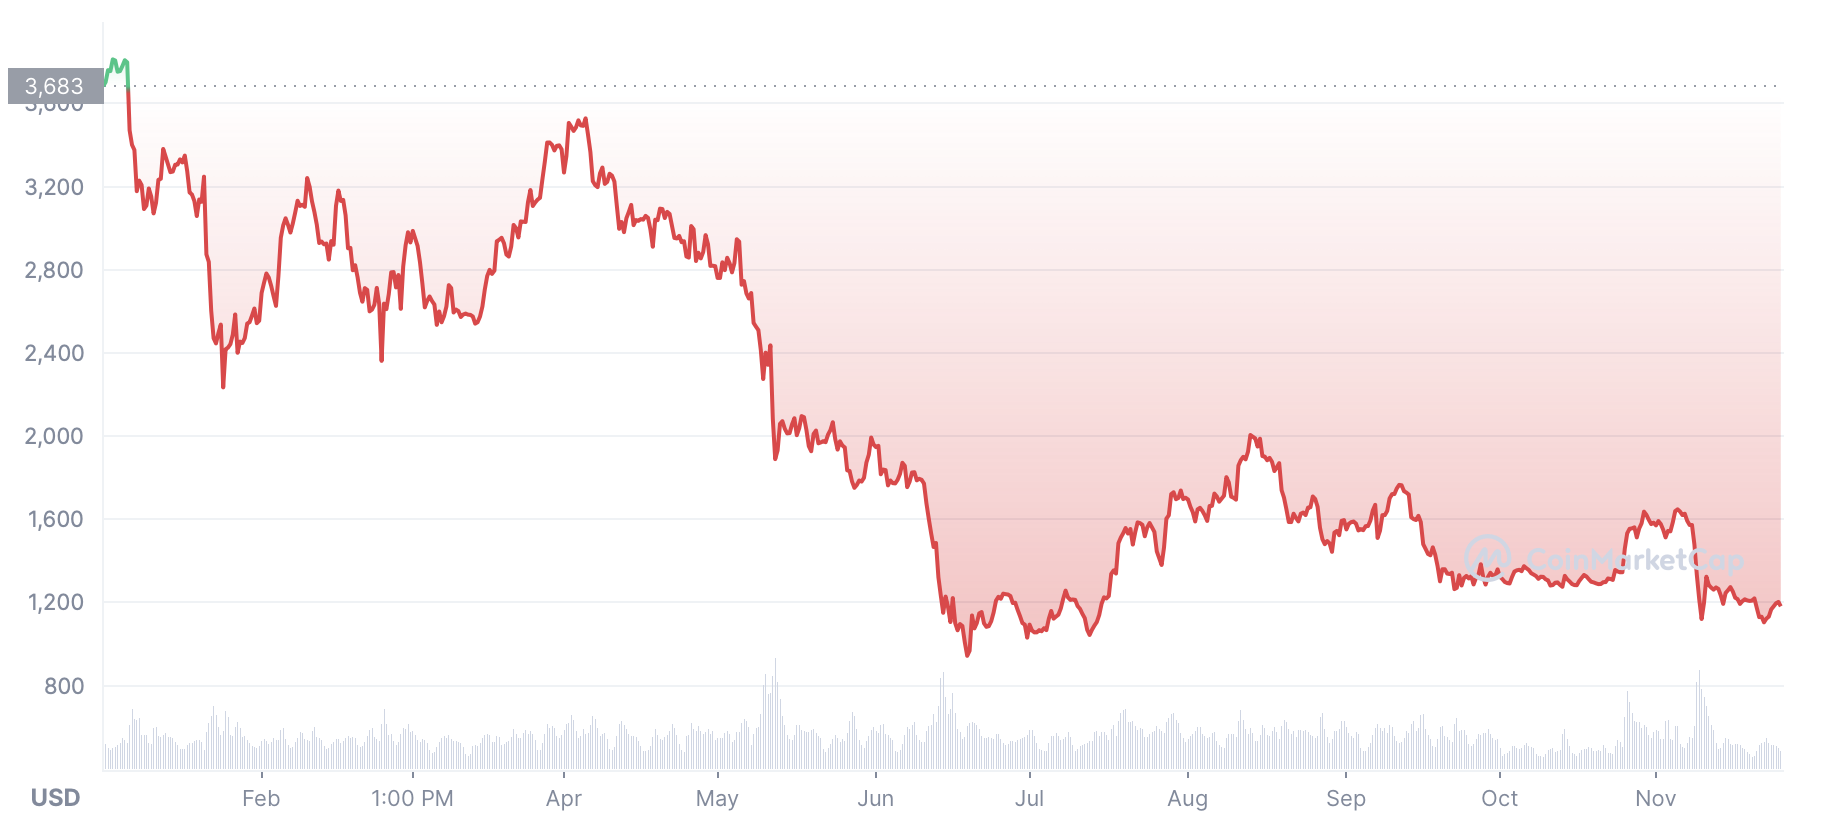
The ETH coin price dropped sharply in the first half of 2022 despite the approach of The Merge, as cryptocurrency markets turned bearish, especially following the collapse of the terraUSD stablecoin (UST) and its accompanying LUNA token in May.
After the news of The Merge’s completion, the coin price went up, meaning that on 15 September it was trading at around $1,640. In the 24 hours after that, though, the price dropped sharply, and on 16 September 2022, it was worth about $1,450.
On 21 October 2022, not even the news that investment company Fidelity would start offering its customers the chance to trade in ether could halt a further decline, with the price dropping to around $1,285. At that time, ETH had a market cap of around $156bn, making it the second-largest crypto by that metric.
The news about the Google node system, on 31 October, coupled with an overall boost to the crypto market – triggered at least partially by crypto enthusiast Elon Musk’s takeover of Twitter (TWTR) – saw ETH trade at a high of $1,630.45. At that time, the coin had a market cap of around $194bn and it remained the second-largest crypto.
A week later, on 7 November, it was worth around $1,580, with a market cap of $193bn, but by 9 November it had sunk to a low of $1,083.29. On 14 December, ETH reached a periodic high of $1,346.17, its highest price since the collapse of FTX, but on 21 December it fell to trade at around $1,215, despite the news that Visa had issued a proposal to allow ETH holders to make automatic payments direct from their crypto wallets.
It hovered around the $1,200 mark for the next two weeks or so, closing the year at $1,194.20 before recovering somewhat in January. A rally saw it break through to $1,563.74 with the price remaining in the $1,500s for the next week or so. It climbed past $1,600 for the first time since November on 18 January and there were more peaks and troughs, with it dipping to $1,530.80 on 25 January, before it recovered and went past $1,700 for the first time since August on 2 February, boosted by the launch of Shanghai's testnet.
It settled down after that but, on 8 February 2023, it was worth about $1,670 before reaching a high of $1,732.80 on 15 February before a market downturn, exacerbated by the collapse of the Silvergate bank, saw it reach a low of $1,378.53 on 10 March. After that, though, ETH recovered, hitting $1,843.84 – its best price since 11 September – on 19 March before further market activity saw it climb past $1,900 for the first time since August 2022 on 5 April. There were peaks and troughs but once Shapella happened, the price of ETH surged, breaking past $2,000 for the first time since May the following day and, on 14 April, it reached a high of $2,126.32. By 18 April 2023, ETH was worth about $2,110.
At that time, it had a market cap of around $251.7m.
The creation of ETHW
Although the markets and many ETH holders had been looking forward to The Merge, there was some concern among the blockchain’s miners, since they stood to lose a fair amount of potential income after the switch to proof-of-stake.
As a result, some miners got together to create something called ETHW, which is a version of Ethereum that will continue to operate with a proof-of-work consensus mechanism. On 12 September 2022, the group – calling itself ETHW Core – tweeted that its mainnet would go live within 24 hours of The Merge.
This came to pass, with the new coin worth about $13.45 at one point early on 16 September 2022. However, it subsequently plunged to around $3.05 by 3 January 2023 before moving back up throughout January to reach a high of $5.26 on 2 February and falling to around $3.50 on 18 April.
Just another PoS blockchain?
It is possible that, without proof-of-work, ETH could become just another proof-of-stake blockchain like its competitors, such as Solana (SOL), Polkadot (DOT) or Avalanche (AVAX).
That said, chains like the three above as well as Tron (TRX), Tezos (XTZ) and Algorand (ALGO), could also benefit. While the six cryptos we have mentioned all dropped in price at the end of last year, they all made something of a recovery in 2023.
There is also the matter of non-fungible tokens (NFTs). Since most, if not all, NFTs are based on Ethereum, the potential for a variety of forks could make it confusing for some NFT holders to know exactly what they own and where exactly that is. That could, in turn, lead to a growth of NFT scams, with items listed for sale which are not, in fact, for sale. Falsely declared airdrops and support scams could also rob people of their money.
ETH to USD
Ethereum price prediction round-up
Let’s take a look at some of the ether price predictions that were being made as of 18 April 2023.
Keep in mind that price forecasts are often wrong. Also, it is important to note that long-term crypto price predictions are often made using an algorithm, which means that they can change at a moment’s notice.
CoinCodex gave a short-term ethereum crypto price prediction for 2023 that estimated ETH could rise to $2,145.67 by 23 April before dropping back to $1,902.58 by 19 May. The site’s technical analysis for ether was highly bullish, with 28 indicators sending out bullish signals against just one being bearish.
Gov Capital had an ethereum price prediction for 2023 that suggested the coin could reach just below $2,587.61 by the end of the year, before climbing to a fraction of a cent above $5,033.84 by the end of 2024 and just below $7,301.05 by the end of 2025.
DigitalCoinPrice had an ethereum price prediction for 2025 that said ETH could reach $6,829.87 that year, lower than Gov Capital’s 2025 ETH price prediction. It projected that the ETH price could average $4,500.84 in 2023 and $5,118.69 in 2024. The site also suggested that the price could reach around $21,611.85 in 2030, based on historical data.
PricePrediction maintained a bullish long-term ethereum forecast that projected ETH could be worth around $2,851.56 in 2023, $4,224.26 in 2024 and $6,442.41 in 2025, based on its artificial intelligence-assisted technical analysis. The website’s ethereum price prediction for 2030 suggested the price could soar to $41,716.25.
When looking for ETH coin price predictions, it is important to keep in mind that cryptocurrency markets remain extremely volatile, making it difficult to accurately predict what a coin’s price will be in a few hours, and even harder to give long-term estimates.
As such, analysts and algorithm-based forecasters can and do get their predictions wrong. If you are considering investing in cryptocurrency tokens, we recommend you conduct your own research. Look at the latest market trends, news, technical and fundamental analysis, and analyst opinions before making any investment or trading decisions.
Keep in mind that past performance is no guarantee of future returns, and never invest any money that you cannot afford to lose.
FAQs
Is Ethereum a good investment?
It is hard to say. A lot will depend on how the market performs going forward and how well received the Shapella upgrade is.
Remember, you should always carry out your own thorough research before making an investment. Even high-market-cap cryptocurrencies can be affected by bear markets, so investors should be prepared to make losses and never purchase more than they can afford to lose.
Will Ethereum go up or down?
No one can really tell right now. Although there is some optimism among forecast sites, it is important to remember that price predictions turn out to be wrong more often than not and prices can, and do, go down as well as up.
In volatile cryptocurrency markets, it is important to do your own research on a coin or token to determine if it is a good fit for your investment portfolio. Whether ETH is a suitable investment for you depends on your risk tolerance and how much you intend to invest, among other factors.
Keep in mind that past performance is no guarantee of future returns, and never invest any money that you cannot afford to lose.
Should I invest in Ethereum?
That is a question that you will have to answer for yourself. Before you do so, however, you will need to conduct your own research.
Never invest more money than you can afford to lose, because prices can go down as well as up.