
Ripple price prediction: Third-party outlook
XRP is the native token of the XRP Ledger. On 15 September, the US Senate failed to advance the CLARITY Act, while spot XRP ETFs continued to record net inflows. Explore third-party XRP price targets and technical analysis. Past performance is not a reliable indicator of future results.
Ripple (XRP/USD) traded near $1.28311 at 9:22am UTC on 16 September 2026, within an intraday range of $1.27078–$1.4536. Past performance is not a reliable indicator of future results.
The move followed a broader crypto decline after the US Senate failed to invoke cloture on the CLARITY Act in a 49–50 vote on 15 September, short of the 60 votes needed to advance the bill (CNBC, 15 September 2026). The result may delay progress towards a federal digital-asset framework, with the setback likely pushing comprehensive federal crypto rules into 2027. Bitcoin and other major cryptocurrencies also traded lower ahead of the Federal Reserve's policy decision, due 16 September 2026 (CoinDesk, 14 September 2026), while XRP-linked spot ETFs continued to record net inflows, with cumulative flows reaching an all-time high of $1.68 billion (CryptoPotato, 6 September 2026). Markets were therefore weighing regulatory uncertainty, monetary policy expectations and ETF demand (Crypto.news, 15 September 2026).
Third-party XRP outlook: CLARITY Act setback, Fed decision
As of 16 September 2026, third-party XRP price predictions reflect different assumptions around ETF demand, token supply and US regulation. These forecasts are estimates rather than indications of future price direction.
Changelly (algorithmic model)
Changelly projects XRP at $1.52 by 17 September 2026, with a September range of $1.38–$2.03 and an average of $1.71. Its model cites moving-average signals and a Fear and Greed Index reading of 57, characterised as 'Greed' (Changelly, 15 September 2026).
Ali Charts, via Yahoo Finance (technical analysis)
Independent analyst Ali Charts identified $1.70 as a near-term target, with $1.60 and $1.68 as intermediate levels and $2.19 as a further target if XRP moved above $1.86. The analysis followed $110.49 million of weekly inflows into US spot XRP ETFs for the week ending 28 August 2026, according to SoSoValue data (Yahoo Finance, 31 August 2026).
Crypto.news (scenario model)
Crypto.news projects a base-case year-end 2026 target of $1.51 within a $1.28–$1.81 range, alongside a three-month projection of $1.47. Its bull scenario extends to $1.60–$2.40 if ETF demand offsets Ripple’s monthly escrow releases of 200 million–400 million XRP (Crypto.news, 16 September 2026).
Coinpedia (chart-based analysis)
Coinpedia reports a chart analyst’s target of $1.94, with intermediate levels at $1.66 and $1.84–$1.86 ahead of $2. The outlook cites eleven consecutive days of spot XRP ETF inflows totalling approximately $170 million as one supporting factor (Coinpedia, 2 September 2026).
Standard Chartered (house view)
Standard Chartered projects XRP at $7 in 2027, $12.60 in 2028 and $19.60 in 2029. Analyst Geoffrey Kendrick linked the outlook to passage of the CLARITY Act and cumulative XRP ETF inflows moving towards $8bn from around $1.49bn at the time cited (24/7 Wall St., 13 September 2026).
Predictions and third-party forecasts are inherently uncertain, as they cannot fully account for unexpected market developments. Past performance is not a reliable indicator of future results.
Ripple: recent developments and upcoming catalysts
The US Senate failed to invoke cloture on the Digital Asset Market CLARITY Act on 15 September 2026, with the vote ending 49–50, short of the 60 votes needed to advance the bill. The legislation remains active, but the setback leaves the timing of further action uncertain, with the outcome likely pushing comprehensive federal crypto rules into 2027 (CNBC, 15 September 2026).
Ripple also unlocked 1 billion XRP from escrow on 1 September, worth approximately $1.38bn at the time, before returning 700 million XRP to escrow. Spot XRP ETFs recorded an eighth consecutive week of net inflows in early September, taking cumulative inflows to $1.68bn, although daily outflows within that period pointed to uneven demand (CryptoPotato, 6 September 2026).
The Federal Reserve concludes its two-day policy meeting on 16 September, with its rate decision, Summary of Economic Projections and dot plot due at 2pm ET. A less restrictive rate outlook could support broader risk appetite, including crypto markets, while tighter policy expectations could weigh on sentiment. The Bank of Japan and Bank of England also hold policy meetings later in the week (CoinDesk, 14 September 2026).
XRP price: technical overview
As of 9:22am UTC on 16 September 2026, the XRP/USD price traded below its 20- and 200-day moving averages near 1.38 and 1.27 respectively, while remaining above its 50- and 100-day averages near 1.24 and 1.17. The 20-day simple moving average (SMA) also remained below the 50-day SMA.
The 14-day relative strength index was near 45.4, within neutral territory and below the 50 midpoint. The average directional index (14) stood near 36.9, above the 25 level often associated with an established trend, although ADX does not indicate direction.
Higher technical references included R1 near 1.72 and R2 near 2.07. Around the quoted price, the central pivot near 1.35 and 200-day SMA near 1.27 provided nearer reference points, while S1 stood lower near 1.01.
The Hull moving average (9) was near 1.32, broadly in line with shorter-term exponential moving averages on the same chart (TradingView, 16 September 2026).
These levels are technical reference points and do not indicate where XRP will move next.
This is technical analysis for informational purposes only and does not constitute financial advice or a recommendation to buy or sell any instrument.
Ripple price history (2024–2026)
XRP/USD’s price traded around $0.59 in mid-September 2024 before rallying through late 2024 and into January 2025, reaching $3.40 on 16 January 2025, its highest level in the two-year period.
It was near $2.94 in early March before falling to $1.79 by 9 April amid a broader risk-off period, then traded mostly within a $2–$3 range through the summer.
XRP fell to $1.12 on 6 February 2026 before recovering above $1.90 later that month. It subsequently reached $0.99 in mid-August, its lowest level in the two-year period, alongside a wider crypto-market decline, before rebounding to $1.68 by 27 August.
As of 9:22am UTC on 16 September 2026, XRP traded near $1.28311. The session remained open at the time of writing, so this does not represent a 16 September closing price.

Past performance is not a reliable indicator of future results. Prices are indicative and may differ from live market prices.
Capital.com analyst view: Ripple
XRP’s price action in 2026 has reflected a mix of asset-specific developments and wider regulatory and macroeconomic conditions.
Spot ETF inflows could support demand if they continue, while weaker or reversing flows could reduce that support. Greater clarity around US crypto regulation may improve sentiment, whereas further legislative delays or tighter rules could weigh on it.
Ripple’s scheduled escrow releases add another variable. Additional circulating supply could put pressure on price if demand does not absorb it, while returning tokens to escrow limits the amount entering circulation.
Broader market conditions matter too. Lower interest-rate expectations or stronger risk appetite could support XRP alongside other digital assets, while tighter monetary policy or weaker crypto sentiment could weigh on prices.
These factors often overlap, making individual price moves difficult to attribute to any single development. Past performance is not a reliable indicator of future results.
Capital.com’s client sentiment for Ripple CFDs
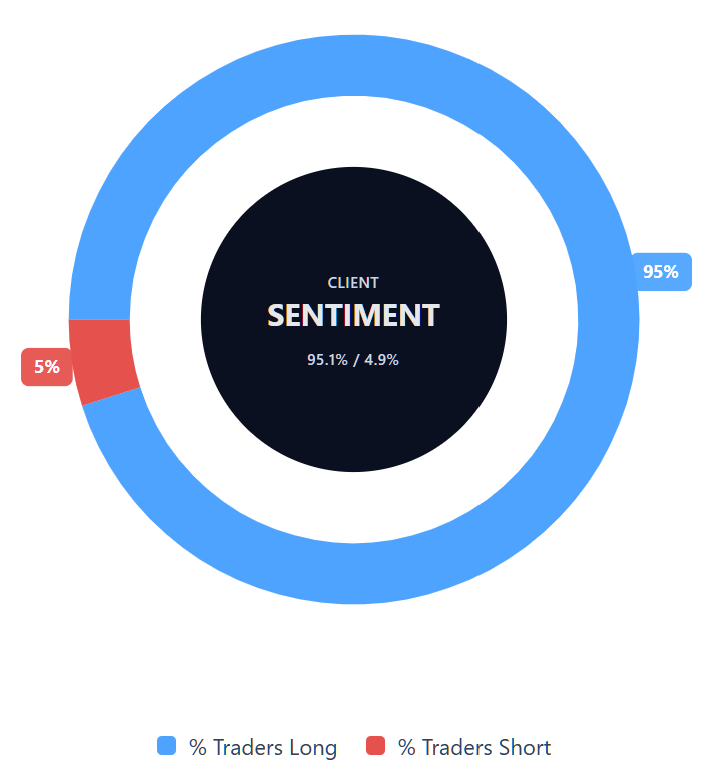
As of 16 September 2026, Capital.com client positioning in Ripple CFDs shows 95.1% buyers and 4.9% sellers, a difference of 90.2 percentage points. This reflects open positions on Capital.com at the time captured, can change and does not indicate future price direction.
Summary – Ripple (2026)
- As of 9:22am UTC on 16 September 2026, XRP traded near $1.28311 within an intraday range of $1.27078–$1.4536.
- According to TradingView data, technical readings placed XRP below its 20- and 200-day moving averages but above its 50- and 100-day averages, with the 14-day RSI near 45.4.
- Key influences include spot ETF flows, Ripple’s escrow releases, US crypto legislation and Federal Reserve policy.
- Sustained ETF demand, clearer regulation or easier monetary conditions could support sentiment, while weaker flows, additional supply or tighter policy could weigh on price.
- Recent attention centres on the failed CLARITY Act cloture vote on 15 September and the Federal Reserve’s 16 September policy decision.
Past performance is not a reliable indicator of future results.
FAQ
What is the latest Ripple crypto price prediction?
Among the forecasts covered in this article, Crypto.news published the most recent 2026 projection on 16 September, with a base-case year-end XRP price of $1.51 within a $1.28–$1.81 range. Other cited projections differ, including targets around $1.52–$1.94 and substantially higher longer-term estimates from Standard Chartered. These forecasts use different assumptions around ETF demand, supply and regulation, and shouldn’t be treated as expected outcomes.
Who owns the most Ripple?
Ripple is a private technology company, while XRP is the digital asset native to the XRP Ledger, so there isn’t a single 'owner' of XRP. Ripple itself remains a major holder. As of 30 June 2026, the company reported holding 37.66bn XRP in total, including 32.6bn XRP placed in escrow (Ripple, accessed 16 September 2026). Ownership outside Ripple is distributed across exchanges, institutions and individual wallets.
How many Ripples are there?
The digital asset is called XRP rather than 'Ripple'. XRP’s maximum supply is capped at 100bn tokens (XRP Ledger, accessed 16 September 2026). Not all of that supply circulates freely: Ripple holds part of its XRP in escrow and releases scheduled amounts over time. In September 2026, for example, Ripple unlocked 1bn XRP before returning 700m to escrow, according to the sources cited in this article.
Could Ripple’s price go up or down?
Yes. XRP can move in either direction as market conditions change. Continued spot ETF inflows, clearer US regulation or easier monetary conditions could support demand and sentiment. Conversely, weaker ETF flows, further regulatory delays, tighter monetary policy or additional XRP entering circulation could weigh on price. These factors often overlap with broader cryptocurrency-market moves, making individual price changes difficult to attribute to one development and leaving future direction uncertain.
Should I invest in Ripple?
Whether XRP is appropriate for you depends on your financial circumstances, objectives and tolerance for risk. The article highlights potential supportive factors including ETF demand and greater regulatory clarity, alongside risks from escrow-related supply, legislative delays and changing monetary conditions. Third-party forecasts vary considerably and shouldn’t be treated as investment recommendations. XRP is also distinct from Ripple, the private company, so buying XRP does not provide ownership or an equity interest in Ripple.
Can I trade XRP CFDs on Capital.com?
Yes, you can trade Ripple CFDs on Capital.com. Trading crypto CFDs lets you speculate on price movements without owning the underlying asset and to take long or short positions. However, contracts for difference (CFDs) are traded on margin, and leverage amplifies both profits and losses. You should ensure you understand how CFD trading works, assess your risk tolerance, and recognise that losses can occur quickly.