Ripple price prediction: RLUSD rollout progress
XRP is the native token of the Ripple network, with price action in late April 2026 shaped by RLUSD rollout progress, regulatory developments and broader crypto market conditions. Explore third-party XRP price targets and technicals. Past performance is not a reliable indicator of future results.
Ripple (XRP/USD) is trading at $1.41 on Capital.com's quote feed as of 9:46am UTC on 27 April 2026, within an intraday range of $1.42–$1.45. Past performance is not a reliable indicator of future results.
Price action comes amid a mix of regulatory and ecosystem developments. The SEC and CFTC jointly classified XRP as a digital commodity on 17 March 2026, formally resolving a five-year legal dispute with Ripple Labs and removing the securities-law overhang that had weighed on the token (Yahoo Finance, 1 April 2026). Separately, Ripple has progressed the full-scale rollout of its RLUSD stablecoin across the XRP Ledger and Ethereum, with cumulative spot XRP ETF inflows surpassing $1.50 billion by early March 2026 and Goldman Sachs allocating nearly $154 million to XRP ETFs as network transaction volumes hit record highs (Ripple, 17 April 2026). Wider crypto market sentiment registered a Fear & Greed score of 33 on 26 April 2026, which Donamics Capital described as a state of fear, while spot Bitcoin ETFs and XRP-related products continued to record net positive inflows in the preceding weeks (Cryptonews, 7 April 2026).
Ripple forecasts diverge as RLUSD rollout stays in focus
As of 27 April 2026, third-party XRP price predictions reflect divergent near-term views shaped by technical structure, ETF flow momentum, CLARITY Act progress and broader macro conditions. The following targets summarise estimates from recognised crypto research and data platforms.
Coinpedia (late-April technical range)
Coinpedia identifies $1.41 as a key near-term support level after XRP slipped below $1.46, with the 30-day rolling VWAP at $1.37 acting as a secondary floor. It says XRP would need to reclaim $1.46 before any meaningful rally could develop, with an upside path towards $1.55 – $1.57 opening only on a clean break above that level and continued XRP ETF inflows and firmer sentiment (Coinpedia, 19 April 2026).
CoinCodex (algorithmic short-term model)
CoinCodex projects XRP at $1.43 by 26 April 2026, with a full-year 2026 range of $1.39 – $2.22 and a December-end target of $1.66. The model cites a neutral 14-day RSI reading of 54.45, Bitcoin halving cycle dynamics and digital commodity classification as the main structural inputs behind that annual range (CoinCodex, 26 April 2026).
Changelly (April – May monthly range)
Changelly places XRP's April 2026 range at $1.40 – $1.42 with an average of $1.41, and projects the May range widening to $1.40 – $1.60 with an average of $1.50. The model points to limited near-term upside in April while flagging May as the month when momentum could expand, with an implied potential return of 12.2% from current levels (Changelly, 25 April 2026).
Yahoo Finance (April best-month performance note)
Yahoo Finance reports that April 2026 had already delivered 10% upside for XRP over the prior week as of 20 April, outperforming Bitcoin, Ethereum and Solana over that period. It identified three catalysts for the move: XRP ETF inflow momentum, CLARITY Act Senate committee progress and improved XRP/BTC ratio dynamics (Yahoo Finance, 20 April 2026).
Standard Chartered (revised macro-conditional target)
Standard Chartered revised its XRP price target down to $2.80 for 2026 from a prior estimate of $8, citing macroeconomic headwinds including Federal Reserve rate policy and geopolitical uncertainty as the main reasons for the downgrade. The $2.80 figure is described as a moderate-conditions scenario and remains conditional on the CLARITY Act clearing the Senate Banking Committee (Yahoo Finance, 20 February 2026).
Predictions and third-party forecasts are inherently uncertain, as they cannot fully account for unexpected market developments. Past performance is not a reliable indicator of future results.
XRP price: Technical overview
The XRP/USD price trades at $1.41 as of 9:46am UTC on 27 April 2026, sitting just below the short-term moving average cluster, where the 10-day simple moving average (SMA) at $1.43 and the 50-day SMA at $1.39 bracket the current price. The 20-day SMA at $1.40 and 30-day SMA at $1.38 both carry buy signals on TradingView's indicator suite, while the 100-day SMA at $1.47 and the 200-day SMA at $1.83 remain above the current price and register sell readings, reflecting the broader longer-term overhang.
Momentum remains mixed. The 14-day relative strength index (RSI) reads 52.08, a neutral level that sits in the mid-range without bias towards either extreme, according to TradingView. The average directional index (ADX) at 18.04 suggests the prevailing trend lacks conviction, as readings below 20 are generally associated with a range-bound or consolidating environment.
On the upside, the classic R1 pivot at $1.53 is the nearest reference above the current price; a daily close above that level would bring R2 near $1.73 into view. On the downside, the classic pivot point at $1.41 sits close to the current price, with S1 at $1.22 as the next reference if that floor gives way, according to TradingView pivot data (TradingView, 27 April 2026).
This is technical analysis for informational purposes only and does not constitute financial advice or a recommendation to buy or sell any instrument.
Ripple price history (2024–2026)
XRP/USD’s price trading near $0.52, during a prolonged consolidation phase that kept the token range-bound between roughly $0.44 and $0.65 for much of mid-2024. A sharper move came in late October 2024, when XRP began climbing from around $0.52 and accelerated through November as broader crypto sentiment improved. By 23 November 2024, XRP had surged to an intraday high of $1.64, more than tripling in under a month.
That momentum carried into December 2024, with XRP touching $2.73 on 17 December before pulling back to close the year at $2.08 on 31 December 2024. The token opened 2026 on a strong note, reaching an intraday peak of $2.42 on 6 January 2026, but sold off steadily through late January and February, sliding from $1.92 on 23 January to an intraday low of $1.12 on 5 February 2026, marking the sharpest single-session drawdown in the dataset.
XRP recovered through March and into April 2026, climbing back towards $1.61 on 17 March before easing again. XRP closed at $1.42 on 27 April 2026, approximately 31.7% lower year to date and 36.9% lower year on year than the 27 April 2025 close of $2.26.
Past performance is not a reliable indicator of future results. Prices are indicative and may differ from live market prices.
Capital.com analyst view: Ripple
XRP's price trajectory over the past two years reflects the token's sensitivity to both regulatory developments and broader crypto market cycles. The resolution of Ripple's legal dispute with the SEC, culminating in XRP's formal classification as a digital commodity in early 2026, removed a significant structural overhang and contributed to the token's sharp appreciation from below $0.55 in mid-2024 to highs above $3 in late 2025.
However, that same rally also illustrated the downside risk inherent in event-driven price moves. Once the regulatory catalyst was absorbed, XRP retraced sharply, falling from above $1.90 in January 2026 to intraday lows near $1.12 in early February, showing how quickly sentiment can reverse in illiquid or overextended conditions.
At current levels near $1.41, XRP sits well below its late-2025 peaks, with the CLARITY Act's progress through the US Senate Banking Committee cited as a potential catalyst for renewed institutional interest via spot ETF products. That said, legislative timelines remain uncertain, and any delay or rejection could weigh on sentiment. Similarly, while RLUSD adoption and growing on-chain activity point to expanding ecosystem utility, network adoption trends can stall, and increased competition from rival payment-focused blockchains remains an ongoing challenge to XRP's market position.
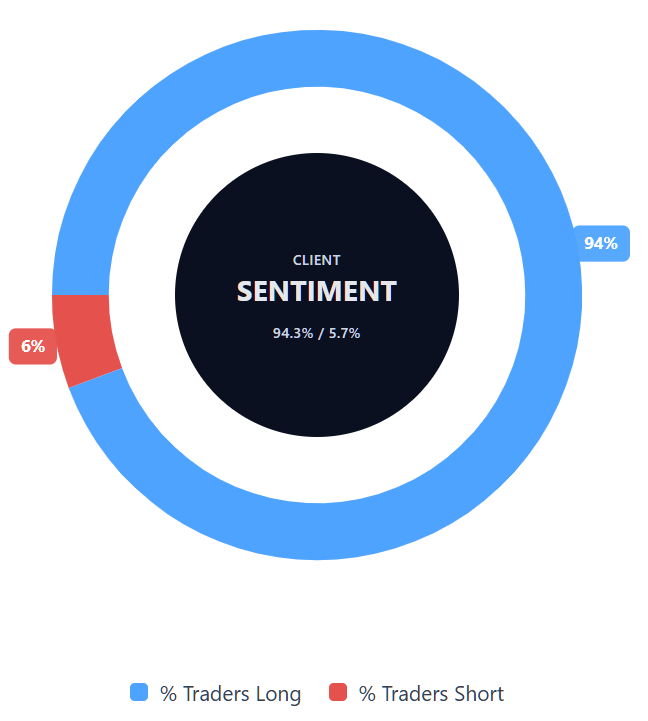
Capital.com’s client sentiment for Ripple CFDs
As of 27 April 2026, Capital.com client positioning in Ripple CFDs stands at 94.3% buyers vs 5.7% sellers, leaving buyers ahead by 88.6 percentage points and placing positioning firmly in heavy-buy, one-sided-towards-longs territory. This snapshot reflects open positions on Capital.com and can change rapidly as market conditions shift.
Summary – Ripple (2026)
- XRP trades at $1.41 as of 9:46am UTC on 27 April 2026, well below late-2025 highs above $3 but significantly above mid-2024 lows near $0.44.
- Key drivers include the SEC/CFTC digital commodity classification, CLARITY Act progress through the US Senate and RLUSD stablecoin adoption across the XRP Ledger and Ethereum.
- Spot XRP ETF filings remain in final regulatory review, with CoinShares reporting $119.6 million in weekly net inflows into XRP-related products as of mid-April 2026.
Past performance is not a reliable indicator of future results.
FAQ
What is the latest Ripple crypto price prediction?
Third-party forecasts cited in the article show a mixed near-term outlook for XRP. Estimates published between 18 and 27 April 2026 cluster around $1.41–$1.57 in technically driven scenarios, while more conditional macro-based projections extend as high as $2.80 for 2026. These targets depend on factors such as ETF-related flows, progress on the CLARITY Act, broader crypto sentiment and the wider macroeconomic backdrop. As with any forecast, they remain uncertain and can change quickly.
Who owns the most Ripple?
Ripple Labs is widely understood to remain the largest holder of XRP, as it was closely involved in the token’s creation and distribution. That said, ownership is concentrated across several categories, including Ripple itself, founders, exchanges, custodians and other large wallets. Because holdings can shift over time, any snapshot of concentration should be treated with caution. For traders, ownership concentration matters because large holders can influence available supply, liquidity and short-term price dynamics.
How much XRP is there?
XRP has a maximum supply of 100 billion tokens, with a large share already in circulation and the remainder released over time from escrow arrangements linked to Ripple. In practice, traders usually focus on circulating supply rather than headline maximum supply, because that gives a clearer view of how much XRP is actively available in the market. Supply structure can matter for price analysis, particularly when it interacts with demand, liquidity, exchange activity and broader sentiment.
Could Ripple’s price go up or down?
XRP’s price could move in either direction, depending on how regulatory, technical and market factors develop. In the article, potential upside drivers include progress on the CLARITY Act, stronger ETF-related inflows and further ecosystem adoption through RLUSD. On the downside, delays to legislation, weaker crypto sentiment, macroeconomic pressure or stronger competition from rival payment-focused blockchains could weigh on the token. Like other cryptoassets, XRP can react quickly to new information and shifting market expectations.
Should I invest in Ripple?
Whether to invest in XRP is a personal decision that depends on your objectives, financial situation, risk tolerance and time horizon. This article does not provide investment advice or a recommendation. Instead, it outlines market context, third-party forecasts and technical levels to help readers understand the factors shaping XRP’s price. Anyone considering exposure should assess both the potential opportunities and the risks, including volatility, regulatory uncertainty and the possibility of losing money.
Can I trade XRP CFDs on Capital.com?
Yes, you can trade Ripple CFDs on Capital.com. Trading crypto CFDs lets you speculate on price movements without owning the underlying asset and to take long or short positions. However, contracts for difference (CFDs) are traded on margin, and leverage amplifies both profits and losses. You should ensure you understand how CFD trading works, assess your risk tolerance, and recognise that losses can occur quickly.