Solana price prediction: ETF inflows lag sell-off
Solana traded below $70 on 8 June 2026, with spot ETF inflows yet to offset wider crypto selling pressure and cautious macro sentiment. Explore third-party SOL price targets and technical analysis. Past performance is not a reliable indicator of future results.
Solana (SOL/USD) is trading at $66.37 as of 2:48pm UTC on 8 June 2026, within an intraday range of $61.53–$67.04. Past performance is not a reliable indicator of future results.
Selling pressure has persisted across the broader crypto market, with Bitcoin also retreating toward the low-$60,000s amid cautious macro sentiment (CNBC, 3 June 2026).SOL has broken below the previously cited $80 and $70 support levels that analysts had flagged as key thresholds (Investing.com, 18 May 2026). Spot Solana ETF products, which had accumulated approximately $1.45bn in total cumulative inflows since launch, have not yet provided a sufficient counterweight to the broader market downturn (OpenPR, 13 March 2026). Institutional demand appears insufficient so far to stabilise prices near current levels.
Solana: ETF inflows and technicals shape third-party targets
As of 8 June 2026, third-party SOL price predictions show a wide forecast range for 2026, shaped by persistent macro headwinds, bearish moving-average signals and the extent to which spot ETF inflows can support demand.
CoinCodex (algorithmic year model)
CoinCodex models a full-year 2026 trading channel for SOL of $65.35–$115.56, with an annualised average of $99.28 and a year-end target of $99.24. The model notes 30 bearish and four bullish technical signals as of that date. Its 14-day RSI reading of 15.28 indicates an oversold condition, while all daily simple and exponential moving averages sit above the current price (CoinCodex, 7 June 2026).
Changelly (moving-average consensus)
Changelly sets SOL's full-year 2026 range at $84.30–$100.21, with a year-average of approximately $92.26. The model draws on moving-average signals across the four-hour, daily and weekly timeframes, with December 2026 carrying its highest monthly average at approximately $100.08 (Changelly, 7 June 2026).
Coinpedia (fundamental and technical outlook)
Coinpedia places SOL's full-year 2026 trading range at $75–$200. It identifies $97 as the critical near-term resistance level that a sustained recovery would need to clear before targeting $116. The analysis cites cumulative spot ETF net inflows of approximately $974.68m and ongoing on-chain fee generation from protocols including Pump.fun and Jupiter as underlying demand anchors. It also suggests that a failure to reclaim $97 could leave SOL exposed to further downside toward $60 (Coinpedia, 3 June 2026).
Yahoo Finance (cycle analysis, contributor)
A Yahoo Finance contributor analysis noted that SOL was trading near $82, with a market capitalisation close to $48bn. It framed any recovery as contingent on Bitcoin stabilising and broader risk-on conditions returning. The piece highlighted Solana's position as a high-throughput layer-1 network with growing stablecoin liquidity and a developing DeFi base as structural positives, without assigning a specific price target (Yahoo Finance, 29 May 2026).
Predictions and third-party forecasts are inherently uncertain, as they cannot fully account for unexpected market developments. Past performance is not a reliable indicator of future results.
SOL price: technical overview
The SOL/USD price is trading at $66.37 as of 2:48pm UTC on 8 June 2026, below its key moving-average cluster. The 20-, 50-, 100- and 200-day SMAs sit at approximately $78, $84, $85 and $102, respectively. With price beneath all four levels, the daily timeframe remains in a bearish alignment. The Hull moving average (9) at $61.68 is the only moving average currently below price, according to TradingView data.
Momentum remains weak. The 14-day RSI registers 28.21, a reading consistent with oversold conditions, while the ADX (14) at 42.99 indicates an established and directionally strong trend is in place – in this case to the downside.
To the upside, the classic pivot point (P) at $86.86 is the first reference above current price. A daily close back above that level would put the R1 zone near $93.85 in view. Beyond there, R2 at $105.37 aligns broadly with the 100- and 200-day SMA shelf between $85 and $102.
On the downside, S1 at $75.34 marks the nearest classic pivot support, with S2 at $68.35 the next meaningful reference below. S3 sits further out near $49.84. The current last price of $66.37 places SOL within the S1-S2 corridor, while the intraday low of $61.53 is approaching S3 territory (TradingView, 8 June 2026).
This is technical analysis for informational purposes only and does not constitute financial advice or a recommendation to buy or sell any instrument.
Solana price history (2024–2026)
SOL/USD’s price opened June 2024 around $163, having climbed sharply from late 2023 lows as broader crypto sentiment improved and anticipation of spot Bitcoin ETF approvals in the US lifted the wider market. From there, SOL pulled back through the summer, dipping to around $111 on 5 August 2024 amid a global equity sell-off triggered by an unwinding of yen carry trades, before recovering to roughly $130 by the end of September.
The main rally came in Q4 2024, with SOL rising to around $295 on 19 January 2025 – its all-time high – supported by post-US election risk appetite, memecoin activity on the Solana network, and renewed institutional interest. That peak proved short-lived. SOL spent most of early 2025 unwinding those gains, and by mid-2025 was trading back in the $145–$175 range amid fading speculative momentum.
2026 brought a sharper deterioration. SOL opened the year near $127, rallied briefly to around $148 in mid-January, then slid steadily through the first half of the year. It fell below $100 in February and continued lower through spring and early summer. As of 8 June 2026, SOL is trading near $66.37, approximately 47.8% down year to date and around 77.5% below its all-time high.
Past performance is not a reliable indicator of future results. Prices are indicative and may differ from live market prices.
Capital.com analyst view: Solana
Solana’s price performance over the past two years reflects the asset’s capacity for sharp directional moves in both directions. SOL climbed to an all-time high near $295 in January 2025, supported by strong network activity, memecoin-driven transaction volumes and broad crypto market enthusiasm following the US presidential election. That momentum has since reversed substantially. As of 8 June 2026, SOL is trading near $66.37, down roughly 77% from that peak and marking eight consecutive months of losses, a streak without precedent in the token’s history.
On one hand, Solana’s underlying network fundamentals – including high throughput, growing stablecoin supply and cumulative spot ETF inflows exceeding $974m – could be viewed as supportive of a longer-term recovery case. On the other hand, all major moving averages currently sit above the price, the 14-day RSI remains in oversold territory, and macro headwinds continue to weigh on risk assets broadly. Those same ETF inflows have not yet stabilised prices through the current drawdown. Whether network fundamentals ultimately translate into price recovery remains uncertain.
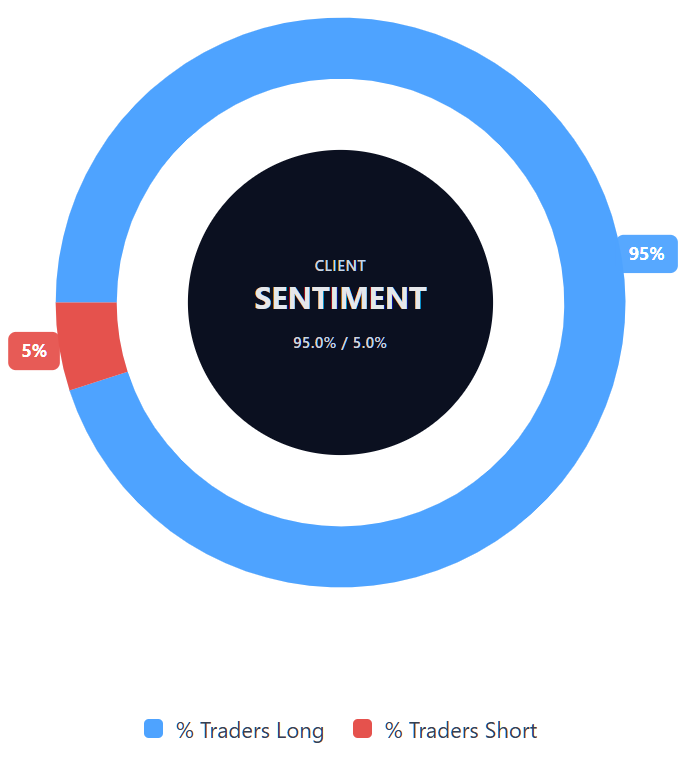
Capital.com’s client sentiment for Solana CFDs
As of 8 June 2026, Capital.com client positioning in Solana CFDs shows 95% buyers versus 5% sellers, putting buyers ahead by 90 percentage points. This points to a heavily one-sided skew toward longs. The snapshot reflects open positions on Capital.com and can change.
Summary – Solana (2026)
- SOL is trading at $66.37 as of 2:48pm UTC on 8 June 2026, down roughly 77% from its all-time high of approximately $295, reached in January 2025.
- Key drivers include macro headwinds weighing on risk assets broadly, eight consecutive monthly losses for SOL, and spot ETF inflows of approximately $974m proving insufficient so far to stabilise price.
- Recent news centres on SOL’s historic losing streak – its longest on record – alongside continued broader crypto market weakness, with Bitcoin also retreating toward the low-$60,000s in early June 2026.
Past performance is not a reliable indicator of future results.
FAQ
What is the latest Solana crypto price prediction?
Third-party Solana price predictions vary widely. In the article snapshot, SOL was trading at $66.37 on 8 June 2026, while algorithmic and research-based 2026 forecasts ranged from around $65–$154, with some year-end midpoints clustering near $99–$100. These forecasts depend on technical indicators, macro conditions, ETF inflows and broader crypto sentiment, and can change quickly. Forecasts are not guarantees, and past performance is not a reliable indicator of future results.
Who owns the most Solana?
Solana ownership is spread across circulating wallets, validators, exchanges, foundations, early backers and other market participants, but wallet data doesn’t always identify the beneficial owner. Public on-chain analysis suggests the largest single SOL wallet controls about 1% of supply, while the top 100 wallets hold a much larger share collectively. However, some wallets may represent exchanges or custodians holding SOL on behalf of many users, so wallet concentration doesn’t always equal individual ownership.
How many Solana coins are there?
Solana doesn’t have a fixed maximum supply in the same way as Bitcoin. Its tokenomics include ongoing issuance, with supply affected by inflation, staking rewards, burns and unlock schedules. Recent tokenomics data puts Solana’s circulating supply at around 579.30m SOL, while total supply is described as uncapped or inflationary rather than fixed. These figures can change as new SOL enters circulation, tokens are staked or unlocked, and network-level supply dynamics evolve.
Could Solana’s price go up or down?
Yes. Solana’s price could move in either direction, and the article shows why the outlook is mixed. On the upside, network activity, stablecoin liquidity, DeFi usage and ETF inflows may support demand over time. On the downside, SOL was trading below key moving averages, with weak momentum, macro pressure and recent monthly losses weighing on sentiment. Crypto markets can be highly volatile, so traders should consider both potential gains and losses before taking a position.
Should I invest in Solana?
Whether Solana is suitable for you depends on your financial goals, risk tolerance, market knowledge and personal circumstances. This article is for informational purposes only and doesn’t constitute investment advice or a recommendation to buy, sell or hold SOL. Solana has shown sharp price moves in both directions, and cryptoassets can be volatile. Before making any decision, consider doing your own research, understanding the risks, and speaking to a qualified financial adviser where appropriate.
Can I trade Solana CFDs on Capital.com?
Yes, you can trade Solana CFDs on Capital.com. Trading crypto CFDs lets you speculate on price movements without owning the underlying asset and to take long or short positions. However, contracts for difference (CFDs) are traded on margin, and leverage amplifies both profits and losses. You should ensure you understand how CFD trading works, assess your risk tolerance, and recognise that losses can occur quickly.