Shiba Inu price prediction: Exchange outflows, burn rate surge
Shiba Inu traded near $0.0000059 on 14 April 2026, with higher exchange outflows and burn activity emerging as notable developments against a weaker broader crypto backdrop. Explore third-party SHIB price targets and technical analysis. Past performance is not a reliable indicator of future results.
Shiba Inu (SHIB/USD) last traded at $0.0000059 as of 9:47am UTC on 14 April 2026, within the session's intraday range of $0.00000575–$0.000006. Past performance is not a reliable indicator of future results.
Pressure on SHIB reflects broader crypto market stress. Bitcoin traded near $74,500 on 14 April after testing the $70,000 support level earlier in the week amid ongoing US tariff policy uncertainty (Yahoo Finance, 14 April 2026). On-chain, CryptoQuant data recorded a 40.5% rise in SHIB exchange outflows on 12 April, with 321 billion SHIB leaving exchanges, while a separate 237% surge in the burn rate on 11 April saw 15.5 million tokens permanently removed, including activity linked to a Robinhood-connected wallet (CoinMarketCap, 14 April 2026).
Shiba Inu price prediction 2026-2030: Analyst price target view
As of 14 April 2026, third-party SHIB price predictions reflect a broadly cautious short-term outlook, shaped by declining on-chain activity, a compressing price range, and weakness across the broader meme coin market.
CoinCodex (algorithmic 2026 range model)
CoinCodex places SHIB within a 2026 trading channel of $0.00000458–$0.00000576, with a year-end target of $0.00000502, representing an approximate 14% decline from current levels. The model applies historical volatility data and Bitcoin halving-cycle inputs, and notes that 27 of 34 technical indicators signal bearish momentum, with the 14-day RSI at 44.22, which is a neutral reading (CoinCodex, 13 April 2026).
Coinpedia (editorial April outlook)
Coinpedia identifies $0.00000500 as the lower boundary of a multi-year accumulation range that SHIB tested in Q1 2026, and notes a potential retest of mid-range resistance near $0.0000070 in April, contingent on bullish demand holding at support. The editorial team sets a 2026 range of $0.0000201–$0.000064, with a projected average near $0.000042, while noting that a failure to sustain momentum could return the price to the $0.00000500 floor (Coinpedia, 8 April 2026).
Benzinga (aggregated consensus overview)
Benzinga aggregates 2026 price targets from CoinCodex, Changelly, Coinpedia, and Wallet Investor, with estimates ranging from $0.0000340 (Wallet Investor) to $0.0000920 (DigitalCoinPrice). The wide dispersion reflects differing assumptions about Shibarium recovery and broader crypto market sentiment. The publication notes that SHIB's price remains sensitive to social media trends and Bitcoin's performance, while also noting that the proliferation of new meme coins continues to dilute investor attention (Benzinga, 11 April 2026).
Yahoo Finance (bearish technical commentary)
Yahoo Finance reported in early March 2026 that SHIB's short-term outlook had turned pessimistic, with the price hovering near $0.0000053 following a 21.5% decline in February, and each recovery attempt capped below $0.0000065 amid heavy overhead supply. The report described a pattern of lower highs and lower lows, with $0.0000053 identified as the critical level where a break lower could expose the token to steeper near-term losses (Yahoo Finance, 3 March 2026).
Predictions and third-party forecasts are inherently uncertain, as they cannot fully account for unexpected market developments. Past performance is not a reliable indicator of future results.
SHIB price: Technical overview
The SHIB/USD price trades at $0.0000059 as of 9:47am UTC on 14 April 2026, sitting just above the classic pivot point of $0.0000059 and below most of its moving-average stack. TradingView data shows the 10-, 20-, 30- and 50-day simple moving averages (SMAs) clustered between $0.00000584 and $0.00000594, all generating sell signals, while the 100- and 200-day SMAs sit higher at $0.00000659 and $0.00000794 respectively, placing the current price well beneath the longer-term moving-average range.
The 50-day SMA at $0.00000584 is the sole buy signal among the SMAs, and the Hull moving average (9) at $0.00000589 also reads buy, suggesting a minor short-term stabilisation attempt. The 14-day relative strength index (RSI) reads 49.58, a neutral reading that indicates neither overbought nor oversold conditions, while the average directional index (ADX) at 18.40 reflects a weak-trend environment without a clear directional impulse, according to TradingView oscillator data.
Classic pivot resistance places R1 at $0.00000652; a daily close above that level would bring R2 at $0.00000709 back into view. To the downside, the classic S1 at $0.00000530 marks the first notable reference below the current pivot, with S2 at $0.00000465 as the next level should S1 give way (TradingView, 14 April 2026).
This is technical analysis for informational purposes only and does not constitute financial advice or a recommendation to buy or sell any instrument.
Shiba Inu price history (2024–2026)
SHIB/USD’s price closed 2024 at $0.00002119, having rallied sharply from mid-year lows to briefly spike as high as $0.00003331 on 8 December 2024, a two-year peak for the token, before giving back a significant portion of those gains into year-end.
2025 proved far tougher. SHIB opened the year near $0.00002171 but sold off steadily through the second half, shedding around 68% over the calendar year to close 2025 at $0.00000691. That decline came despite a brief recovery attempt in the summer months, when prices climbed back above $0.00001500 in July and early August before rolling over again.
Into 2026, SHIB made one more push higher, touching an intraday high of $0.00001011 on 5 January before resuming its downtrend. SHIB last closed at $0.0000059 on 14 April 2026, approximately 21.0% down year to date and 51.0% lower year on year.
Past performance is not a reliable indicator of future results. Share prices are indicative and may differ from live market prices.
Capital.com analyst view: Shiba Inu
SHIB's price trajectory over the past two years reflects the broader volatility that characterises the meme coin market. The token reached a two-year intraday high of $0.00003331 in December 2024, supported by post-election crypto optimism and a surge in retail interest, before declining sharply through 2025, losing approximately 68% over the calendar year. A brief recovery attempt in early January 2026, when SHIB touched $0.00001011, failed to hold, and the token has since compressed into a narrow range around $0.0000059. On-chain data points to reduced exchange supply and elevated burn activity as factors that some analysts cite as potential demand support. However, declining open interest and a sustained pattern of lower highs suggest that selling pressure has not yet fully dissipated.
The Shibarium ecosystem continues to develop, which proponents argue could broaden SHIB's utility beyond speculative trading, though critics note that adoption metrics remain modest relative to the token's market capitalisation and that SHIB faces intensifying competition from a growing field of rival meme coins. Macro conditions, including uncertainty around US trade policy and broader risk-off sentiment in crypto markets, add further complexity to the near-term picture.
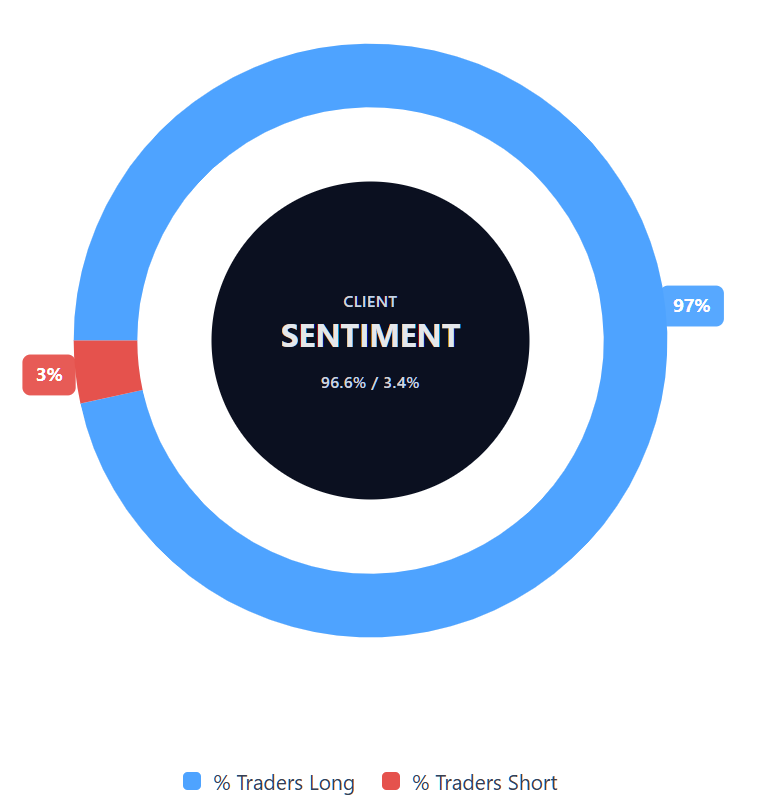
Capital.com’s client sentiment for Shiba Inu CFDs
As of 14 April 2026, Capital.com client positioning in Shiba Inu CFDs shows 96.6% buyers and 3.4% sellers, putting buyers ahead by 93.2 percentage points and placing sentiment firmly in a heavy-buy, one-sided-towards-longs territory. This snapshot reflects open positions on Capital.com and can change.
Summary – Shiba Inu (2026)
- As of 9:47am UTC on 14 April 2026, Shiba Inu (SHIB) was trading at $0.0000059, within a session range of $0.00000575–$0.000006.
- TradingView technical data shows 11 of 13 moving averages signalling sell, with the 14-day RSI at 49.58, a neutral reading offering no clear directional bias.
- Key price drivers include broader crypto market weakness tied to US tariff uncertainty, with Bitcoin testing the $70,000 support level earlier in April 2026.
- On-chain data recorded a 237% surge in SHIB's burn rate on 11 April and a 40.5% rise in exchange outflows on 12 April, which some analysts cite as potential demand signals.
Past performance is not a reliable indicator of future results.
FAQ
What is the latest Shiba Inu crypto price prediction?
Who owns the most Shiba Inu?
How many Shiba Inu coins are there?
Could Shiba Inu’s price go up or down?
Should I invest in Shiba Inu?
Can I trade Shiba Inu CFDs on Capital.com?
Yes, you can trade Shiba Inu CFDs on Capital.com. Trading crypto CFDs lets you speculate on price movements without owning the underlying asset and to take long or short positions. However, contracts for difference (CFDs) are traded on margin, and leverage amplifies both profits and losses. You should ensure you understand how CFD trading works, assess your risk tolerance, and recognise that losses can occur quickly.