Solana price prediction: ETF inflows, Alpenglow upgrade
Solana is a blockchain token in focus after spot SOL ETFs recorded fresh inflows and the network’s Alpenglow upgrade remained central to discussions about adoption and performance.
Explore third-party SOL price targets and technical analysis. Past performance is not a reliable indicator of future results.
Solana (SOL/USD) is trading at $84.91 as of 9:29am UTC on Monday, 27 April 2026, within an intraday range of $84.90–$88.03. Past performance is not a reliable indicator of future results. Sentiment around SOL has been shaped by several concurrent developments. Spot Solana ETFs recorded $7.33 million in net inflows on 23 April 2026, according to SoSoValue data reported by CryptoNews.net, with BSOL (Bitwise Solana Staking ETF) leading at $6.20 million and VSOL (VanEck) adding $1.13 million, pushing total ETF net assets to $874.13 million and cumulative net inflows since inception past $1.02 billion (CryptoNews.net, 25 April 2026).
Separately, the Alpenglow consensus upgrade, which targets a reduction in transaction finality from approximately 12.8 seconds to sub-150 milliseconds, remains in focus as a network development (Bitcoin.com News, 13 March 2026), while Interactive Brokers' launch of SOL trading for European investors via Zero Hash widened direct access to the asset (Interactive Brokers Ireland, 31 March 2026).
2026–2030 Solana outlook: ETF inflows and Alpenglow in focus
As of 27 April 2026, third-party SOL price predictions reflect a wide spread of near-term outlooks shaped by technical structure, on-chain network developments and broader crypto market conditions. The following targets summarise leading model and analyst projections for SOL as of late April 2026.
Coinpedia (technical breakout scenario)
Coinpedia notes SOL is holding near $86 with a developing cup-and-handle formation on higher timeframes, identifying $95 – $100 as the next supply cluster on a confirmed breakout, and $80 – $82 as the first support layer. The analysis flags that futures volume has risen while open interest remains stable, indicating controlled positioning rather than directional accumulation, amid stablecoin supply on the network climbing to approximately $17.4 billion (Coinpedia, 27 April 2026).
Changelly (moving-average model)
Changelly places SOL's April 2026 monthly range between a floor of $86.03 and a ceiling of $87.31, with an average of $86.67, while projecting a recovery towards $100.36 – $104.54 in May 2026. The model derives these levels from moving-average signals across multiple timeframes, noting that the 200-day SMA has been in decline while the 50-day SMA continues to sit above the current spot price (Changelly, 25 April 2026).
CoinCodex (algorithmic cycle model)
CoinCodex sets a 30-day price target of $104.73 for SOL, representing approximately 21% upside from the 26 April 2026 spot price of $86.50, within a broader 2026 range of $87.41 – $132.45. The model registers neutral sentiment based on 15 bullish versus 14 bearish technical signals, with the 14-day RSI at 51.68 and the 50-day SMA at $85.82, while the 200-day SMA sits considerably higher at $122.07 (CoinCodex, 26 April 2026).
Coinpedia (full-year scenario analysis)
Coinpedia's full-year model sets a 2026 trading range of $75 – $200 for SOL, with a near-term conditional recovery towards $110 – $120 if price sustains a break above $97, and a bearish flush towards $60 if $80 support fails decisively. The analysis cites Alpenglow and Firedancer upgrades as improving scalability, alongside cumulative spot ETF net inflows of $974.68 million since listing, with the last major single-day inflow of $11.5 million recorded on 10 April 2026 (Coinpedia, 22 April 2026).
Predictions and third-party forecasts are inherently uncertain, as they cannot fully account for unexpected market developments. Past performance is not a reliable indicator of future results.
SOL price: Technical overview
The SOL/USD price is trading at $84.91 as of 9:29am UTC on 27 April 2026, with the daily chart reflecting broad selling pressure across the moving-average stack. The 20/50/100/200-day SMAs sit at approximately $85 / $86 / $91 / $121, each signalling a sell reading per TradingView data, with price below all four levels. The 30-day SMA near $84 is the sole moving-average buy signal, offering a marginal reference just beneath current price.
Momentum is subdued: the 14-day RSI stands at 49.13, a neutral reading that indicates a lack of strong directional conviction, while the average directional index at 8.26 points to a weak trend environment, as a reading below 15 typically reflects an absence of established directional momentum.
On the topside, the classic R1 pivot at $94.21 is the first reference above current price; a daily close through that level would put the R2 area near $105 in view. To the downside, the classic pivot point at $86.61 sits just above spot and represents initial support, with S1 at $75.51 as the next reference if that level gives way.
The Hull moving average (9-period) at $86.31 and the volume-weighted moving average at $85.65 both register sell signals, consistent with the broader moving-average picture across the daily timeframe (TradingView, 27 April 2026).
This is technical analysis for informational purposes only and does not constitute financial advice or a recommendation to buy or sell any instrument.
Solana price history (2024–2026)
SOL/USD’s price closed 2024 at $189.39, capping a strong year as broader crypto sentiment lifted the wider market.
The token carried that momentum into early 2025, reaching an intraday high of $295.91 on 19 January 2025 before pulling back sharply. A sustained sell-off through the spring took SOL to an intraday low of $95.41 on 7 April 2025, as global macro pressure and a broader digital-asset correction weighed on prices. A recovery into year-end saw SOL rebound towards $172.33 on 11 November 2025, before closing the year at $124.77—a decline of approximately 34.1% from the 2024 close.
2026 opened at $124.77, and a brief rally pushed SOL to an intraday high of $148.77 on 14 January. That peak proved short-lived, with the token retracing through February and settling into a tighter range through April. SOL last closed at $85.33 on 27 April 2026, approximately 31.6% down year to date and 42.5% lower year on year.
Past performance is not a reliable indicator of future results. Prices are indicative and may differ from live market prices.
Capital.com analyst view: Solana
Solana's price trajectory over the past year reflects a token caught between strong network fundamentals and a difficult broader market environment. The Alpenglow consensus upgrade, which targets a reduction in transaction finality to sub-150 milliseconds, alongside growing institutional access via spot ETFs and Interactive Brokers' April 2026 European launch, represents meaningful catalysts that some market participants view as supportive of longer-term demand. That said, SOL remains a high-beta asset: the same sensitivity to market sentiment that can amplify recoveries also accelerates drawdowns, as the year-to-date decline of approximately 31.6% from January's opening level illustrates.
Macro conditions add another layer of complexity. A softer US dollar and expectations of easing Federal Reserve policy could support risk assets, including cryptocurrencies. However, if inflation proves stickier than expected or global growth disappoints, capital rotation away from higher-risk digital assets remains a credible scenario. Cumulative spot ETF inflows approaching $975 million suggest growing institutional engagement, though outflow episodes have also occurred, and sustained inflows are not guaranteed.
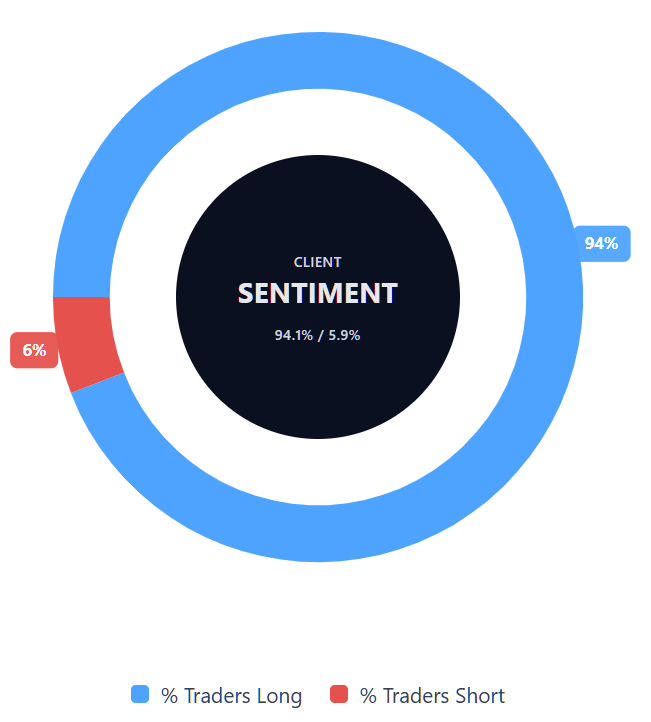
Capital.com’s client sentiment for Solana CFDs
As of 27 April 2026, Capital.com client positioning in Solana CFDs shows 94.1% buyers vs 5.9% sellers, putting buyers ahead by 88.2 percentage points and placing sentiment firmly in heavy-buy, one-sided territory. This snapshot reflects open positions on Capital.com and can change.
Summary – Solana (2026)
- As of 9:29am UTC on 27 April 2026, SOL is trading at $84.91, within an intraday range of $84.90–$88.03.
- Key drivers include spot ETF inflows approaching $975 million cumulatively, the Alpenglow network upgrade targeting sub-150ms finality, and expanded institutional access via Interactive Brokers Europe.
- Macro conditions remain a headwind. US GDP and Core PCE releases scheduled for late April 2026 are flagged as potential volatility catalysts for risk assets, including crypto.
Past performance is not a reliable indicator of future results.
FAQ
What is the latest Solana crypto price prediction?
As of late April 2026, third-party Solana price forecasts vary rather than point to a single outcome. Near-term models in the article cluster largely in the $86–$105 range, while broader 2026 scenarios span from around $75 in weaker conditions to as high as $200 in stronger ones. Those differences reflect changing assumptions around technical levels, network upgrades, ETF flows and wider crypto market conditions. Forecasts can change quickly and are not guaranteed.
Who owns the most Solana?
The article does not identify a single holder as owning the most Solana. Instead, it focuses on market drivers such as spot ETF inflows, broader institutional participation and network developments. Ownership in crypto assets can be concentrated across wallets linked to founders, early backers, exchanges, custodians or investment products, but wallet data does not always show the ultimate beneficial owner. For that reason, ownership concentration should be interpreted with care.
How much SOL is there?
This article does not set out Solana’s exact circulating or total supply. Its focus is price action, third-party forecasts, technical indicators and market catalysts rather than tokenomics. When assessing supply, traders usually distinguish between total supply, circulating supply and tokens that may be locked, staked or otherwise unavailable for trading. Those figures can influence market behaviour, but they should be viewed alongside liquidity, demand, network usage and broader risk sentiment.
Could Solana’s price go up or down?
Solana’s price could move in either direction, depending on how technical, fundamental and macro factors develop. In the article, potential support comes from network upgrades such as Alpenglow, continued ETF inflows and broader access through new trading channels. On the other hand, weaker crypto sentiment, sticky inflation, slower growth or a break below key support levels could weigh on the price. That two-sided setup is why forecasts remain wide and conditional rather than fixed.
Should I invest in Solana?
Whether Solana is suitable for you depends on your objectives, risk tolerance and understanding of the market, and this article does not provide investment advice. Solana has shown large price swings, including sharp drawdowns as well as periods of recovery, which means both gains and losses can be amplified. If you are researching the asset, it may help to consider volatility, liquidity, market drivers and your own risk-management approach before making any financial decision.
Can I trade Solana CFDs on Capital.com?
Yes, you can trade Solana CFDs on Capital.com. Trading crypto CFDs lets you speculate on price movements without owning the underlying asset and to take long or short positions. However, contracts for difference (CFDs) are traded on margin, and leverage amplifies both profits and losses. You should ensure you understand how CFD trading works, assess your risk tolerance, and recognise that losses can occur quickly.