Solana price prediction
Explore third-party SOL price targets and technical analysis.
Solana (SOL/USD) is trading at $82.36 on the Capital.com feed at 2:46pm UTC on 13 April 2026, within a session range of $81.41–$85.52. Past performance is not a reliable indicator of future results.
Sentiment remains subdued across the broader crypto complex, with Bitcoin trading near $71,000 and the macro backdrop shaped by a record-low University of Michigan consumer sentiment reading and uncertainty around US–Iran talks, which weighed on risk assets on 13 April (KuCoin, 13 April 2026). On-chain pressure from the 1 April 2026 Drift Protocol exploit, in which approximately $285 million was drained from Solana's largest DeFi protocol, continues to weigh on ecosystem confidence after Solana's total value locked contracted from roughly $9 billion to approximately $5.5–$6 billion (Chainalysis, 9 April 2026).
Solana price prediction 2026-2030: Analyst price target view
As of 13 April 2026, third-party SOL price predictions reflect a wide range of near-term and full-year estimates, shaped by persistent ETF outflow pressure, the fallout from the April 2026 Drift Protocol exploit, and a broadly bearish technical setup across multiple timeframes.
BeInCrypto (April 2026 scenario range)
BeInCrypto sets a bull-case ceiling for April 2026 at $100 and a bear-case floor at $67.44, with the Supertrend support at $79.67 identified as the key level on a daily close basis. The publication notes that US spot SOL ETFs recorded $6.17 million in net outflows on 30 March 2026, pulling total net assets to $801.91 million from a 17 March peak of $936.95 million, which added near-term headwinds to demand (BeInCrypto, 30 March 2026).
Yahoo Finance (April 2026 outlook)
Yahoo Finance contributor analysis flags $95 as the pivotal resistance level for April, noting that a sustained break above that threshold would be required to shift short-term momentum, while a failure to hold the $80 zone could lead to a retest of the $67–$70 range last seen in early February 2026. The piece cites broader risk-off sentiment driven by US tariff uncertainty as the primary macro headwind weighing on altcoin demand (Yahoo Finance, 31 March 2026).
Changelly (April 2026 monthly model)
Changelly places SOL's April 2026 trading band between $81.55 and $106.32, with a monthly average near $93.94, derived from moving-average signals across the four-hour, daily, and weekly timeframes. The model flags that the 200-day SMA has been in decline since 3 March 2026 and that the 50-day SMA sits above the spot price across all three chart timeframes, reflecting subdued near-term trend momentum (Changelly, 11 April 2026).
Coinpedia (full-year 2026 range)
Coinpedia places SOL's 2026 trading range between $75 and $200, noting that a sustained bullish reversal requires the price to first clear $97 before retesting $116, with the $180–$200 zone aligning with the upper border of the multi-month falling wedge pattern on the weekly chart. The publication also notes that US spot SOL ETFs held approximately $805.84 million in combined net assets by the end of Q1 2026, representing around 1.69% of Solana's total market capitalisation, with inflow momentum stalling in March and reversing in the final week of the quarter (Coinpedia, 11 April 2026).
CoinCodex (algorithmic year-end 2026 target)
CoinCodex models a year-end 2026 SOL price of $130.87, within a full-year channel of $82.29–$145.01 and an annualised average of $126.49, with a one-month projection of $107.16 by 12 May 2026. The model notes that 25 of 30 technical indicators currently signal bearish conditions, that the 14-day RSI sits at 51.71 in neutral territory, and that the 200-day SMA at $125.59 remains materially above current spot, with the 50-day SMA at $86.58 representing the first meaningful overhead reference (CoinCodex, 12 April 2026).
Predictions and third-party forecasts are inherently uncertain, as they cannot fully account for unexpected market developments. Past performance is not a reliable indicator of future results.
SOL price: Technical overview
The SOL/USD price is trading at $82.36 as of 2:46pm UTC on 13 April 2026, with the price sitting below its entire moving-average stack according to TradingView data. The 20/50/100/200-day SMAs are aligned at approximately $83 / $85 / $99 / $130, all registering sell signals, with the Hull moving average (9) at $83.42 and the volume-weighted moving average (20) at $83.05 adding to the overhead cluster just above current spot.
Momentum indicators present a mixed but predominantly cautious picture. The 14-day relative strength index sits at 46.81, in neutral territory, while the average directional index at 12.60 indicates a weak, low-conviction trend environment, falling below the 15 threshold that typically characterises a trending market.
Using classic pivot levels, the pivot point at $86.61 represents the nearest overhead reference. A daily close above that level would put R1 at $94.21 in view, with R2 at $105.31 as the next reference beyond. On the downside, S1 at $75.51 is the next notable level below the session low, with S2 at $67.91 representing a deeper reference if near-term support gives way (TradingView, 13 April 2026).
This is technical analysis for informational purposes only and does not constitute financial advice or a recommendation to buy or sell any instrument.
Solana price history (2024–2026)
SOL/USD’s price opened April 2024 trading near $152, having climbed sharply during a broader crypto rally in early 2024. The token held within the $130–$165 range through Q2 before slipping back toward $110–$130 over the summer.
A sustained rally through the autumn lifted SOL above $200 by late October 2024, with the token peaking intraday at $265.76 on 22 November 2024 as post-US-election risk appetite swept across crypto markets. SOL closed 2024 at $189.39, up roughly 24% from its April 2024 level.
The rally extended into early 2025, with SOL touching a two-year intraday high of $295.91 on 19 January 2025 amid speculation around potential US spot crypto ETF approvals. That momentum faded sharply: by March 2025, the token had retreated into the $120–$140 range, and it closed the year at $124.77.
In 2026, the token came under further pressure. SOL dropped to a two-year intraday low of $67.64 on 6 February 2026 before partially recovering; the Drift Protocol exploit in early April added ecosystem headwinds. SOL closed at $82.80 on 13 April 2026, approximately 33.6% down year to date and 35.6% below its level on the same date in 2025.
Past performance is not a reliable indicator of future results. Share prices are indicative and may differ from live market prices.
Capital.com analyst view: Solana
Solana's performance over the past two years illustrates the sharp cyclicality that characterises the broader crypto market. The token surged to a two-year intraday high of $295.91 in January 2025, supported by institutional interest, ETF-related optimism, and strong on-chain activity across DeFi and payments. However, that momentum has since unwound considerably, with SOL trading near $82 in April 2026, weighed down by the fallout from the April 2026 Drift Protocol exploit, sustained ETF outflows, and a macro environment shaped by US tariff uncertainty and softer risk appetite. These headwinds have also reduced ecosystem confidence and total value locked materially from prior peaks.
Looking at the broader picture, Solana's throughput capacity and growing role in stablecoin and micropayment infrastructure continue to attract developer and institutional attention, which some observers cite as a longer-term source of support. At the same time, the protocol's exposure to DeFi-specific risks, demonstrated by the $285 million Drift exploit, and its sensitivity to shifts in speculative sentiment mean that recoveries can prove fragile. The network's path forward depends partly on how effectively it addresses security concerns and whether ETF inflows resume as macro conditions evolve.
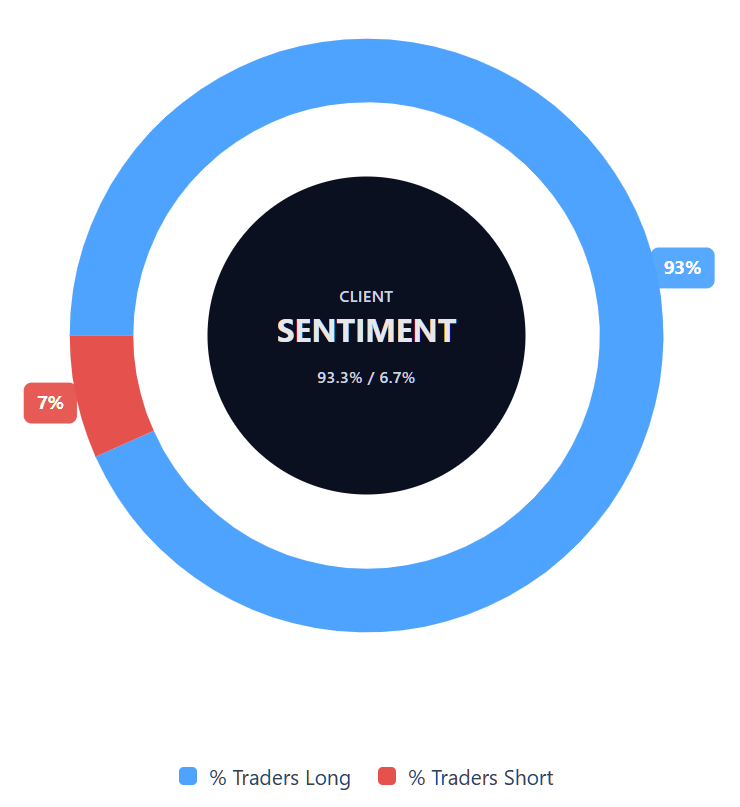
Capital.com’s client sentiment for Solana CFDs
As of 13 April 2026, Capital.com client positioning in Solana CFDs reads 93.3% buyers vs 6.7% sellers, putting buyers ahead by 86.6 percentage points and placing sentiment firmly in heavy-buy, one-sided-toward-longs territory. This degree of skew indicates that the overwhelming majority of open positions on the platform are held long, though heavily lopsided readings can reflect contrarian risk as much as directional conviction. This snapshot reflects open positions on Capital.com and can change.
Summary – Solana (2026)
- SOL trades at $82.36 as of 2:46pm UTC on 13 April 2026, down roughly 33.6% year to date and 45.7% below its April 2024 level of about $152.
- The April 2026 Drift Protocol exploit drained approximately $285 million from Solana's largest DeFi protocol, contracting ecosystem TVL and weighing on near-term confidence.
- US-listed SOL spot ETFs recorded sustained net outflows through late March and early April 2026, pulling combined net assets to approximately $801 million–$806 million from a mid-March peak near $937 million.
Past performance is not a reliable indicator of future results.
FAQ
What is the latest Solana crypto price prediction?
Third-party Solana price forecasts in the article vary widely, which shows how uncertain short-term and full-year projections can be. Near-term April 2026 scenarios range from about $67 to $106, while some year-end 2026 models extend towards the $130–$145 area, and broader full-year ranges run as high as $200. These are third-party estimates rather than guarantees, and they reflect changing factors such as ETF flows, technical levels, market sentiment and ecosystem developments.
Who owns the most Solana?
Solana ownership is spread across several groups, including the Solana Foundation, early backers, developers, validators and individual holders. Large wallets can hold a meaningful share of supply, but concentrations can change over time as tokens move between exchanges, custodians and private addresses. Because wallet data does not always show the beneficial owner clearly, it is not always possible to identify one single definitive largest holder from market commentary alone.
How many Solanas are there?
The number of Solana tokens in circulation changes over time because SOL has an inflationary issuance model and tokens may also be staked across the network. That means there is a difference between total supply and circulating supply, and both can shift as new tokens enter circulation. When reviewing supply figures, it helps to check whether a source refers to circulating supply, total supply or fully diluted supply, as each measure gives a slightly different picture.
Could Solana’s price go up or down?
Yes. As the article shows, Solana’s price can move sharply in either direction, sometimes over short periods. Price action may be influenced by broader crypto sentiment, ETF inflows or outflows, technical resistance and support levels, macroeconomic developments, and network-specific events such as exploits or changes in ecosystem activity. That mix means bullish and bearish scenarios can both remain plausible at the same time, especially when market conditions are uncertain.
Should I invest in Solana?
Whether Solana is suitable for you depends on your objectives, risk tolerance, time horizon and understanding of the market. The article is informational only and does not provide investment advice or a recommendation. Solana has shown strong upside during favourable periods, but it has also experienced steep declines and event-driven volatility. Anyone considering exposure should understand the risks, do their own research, and consider how a volatile crypto asset would fit within their broader strategy.
Can I trade Solana CFDs on Capital.com?
Yes, you can trade Solana CFDs on Capital.com. Trading crypto CFDs lets you speculate on price movements without owning the underlying asset and to take long or short positions. However, contracts for difference (CFDs) are traded on margin, and leverage amplifies both profits and losses. You should ensure you understand how CFD trading works, assess your risk tolerance, and recognise that losses can occur quickly.