Ethereum price prediction: Fifth month of ETF outflows
Ethereum is the native token of the Ethereum blockchain, with current price action shaped by persistent spot ETF outflows, US trade-policy uncertainty, and upcoming US macroeconomic data. Past performance is not a reliable indicator of future results. Explore third-party ETH price targets.
Ethereum (ETH/USD) is trading at $2,030.94 as of 12:57pm UTC on 2 April 2026, according to Capital.com's quote feed, after an intraday session that ranged between $2,030.94 and $2,156.72. Past performance is not a reliable indicator of future results.
Sentiment around ETH has been weighed down by several converging factors. Spot Ethereum ETFs recorded their fifth consecutive month of net outflows in March, with total redemptions exceeding $2.4 billion since the funds' inception period began reversing (Yahoo Finance, 1 April 2026). U.S. trade policy uncertainty has also pressured broader crypto markets. The Trump administration's 10% global surcharge under Section 122 of the Trade Act, in place since late February (White & Case, 2 March 2026), has sustained a risk-off backdrop across digital assets. Additionally, macro attention is focused on U.S. non-farm payrolls data due on 2 April 2026 and upcoming Federal Reserve rate-guidance signals, both of which analysts note could influence near-term sentiment across risk assets, including cryptocurrencies (DL News, 1 April 2026).
Ethereum price prediction 2026-2030: Analyst price target view
As of 2 April 2026, third-party ETH price predictions reflect a broadly cautious near-term outlook, with recovery scenarios contingent on macro conditions and demand returning at key support levels. The following targets summarise estimates from distinct sources within that window.
CoinCodex (short-term technical model)
CoinCodex projects ETH reaching $2,278.54 by 4 April 2026, representing a 10.92% gain from the 30 March 2026 reference price of $2,069.81. The model notes that 82% of tracked indicators signal a bearish reading as of that date, with the Fear & Greed Index registering 8 (extreme fear), while key support levels are identified at $1,947.05, $1,910.66 and $1,877.38 (CoinCodex, 30 March 2026).
Coinpedia (Q2 2026 recovery scenario)
Coinpedia places a Q2 2026 recovery target at $2,878, citing accumulation at the $1,700–$1,900 support band and growing whale transaction counts above $1 million as signals of institutional positioning near $2,000. A subsequent retest of $4,076 is flagged as a secondary scenario later in 2026, contingent on demand exceeding the current threshold for a confirmed directional move (Coinpedia, 28 March 2026).
Changelly (April 2026 model range)
Changelly's model estimates an April 2026 trading range of $2,050.07–$2,464.99, with a monthly average of $2,257.53. The service notes that the 200-day moving average support has been rising since 28 March 2026 on the four-hour chart, while it also flags a bearish 50-day moving average on the daily timeframe as a counterweight, amid an overall extreme fear sentiment reading of 11 (Changelly, 31 March 2026).
Standard Chartered (institutional year-end target)
Standard Chartered maintains a year-end 2026 ETH price target of $4,000, revised down from its prior $7,500 estimate, with the bank citing weak spot ETF inflow data and sustained macro uncertainty as the primary reasons for the reduction. The bank also flags a potential near-term trough near $1,400 before any recovery towards that level, tying the pace of any rebound to Federal Reserve rate-cut timing, which it did not anticipate before June 2026 (Yahoo Finance, 3 March 2026).
Predictions and third-party forecasts are inherently uncertain, as they cannot fully account for unexpected market developments. Past performance is not a reliable indicator of future results.
ETH price: Technical overview
The ETH/USD price trades at $2,030.94 as of 12:57pm UTC on 2 April 2026, per Capital.com's quote feed, with the session ranging between $2,030.94 and $2,156.72. The daily moving-average picture is uniformly bearish: TradingView's oscillator summary shows all 12 tracked moving averages on a sell signal, with the 20/50/100/200-day SMAs positioned at $2,119 / $2,044 / $2,440 / $3,030, with each sitting above the current price and acting as a descending shelf of resistance.
The 50-day SMA at $2,044 is the nearest overhead reference in the short-term cluster. Price is currently trading fractionally below it, and a sustained daily close above that level would put the 20-day SMA at $2,119 back in view. Beyond there, the classic R1 pivot at $2,357 represents the first meaningful resistance reference, with R2 at $2,611 a secondary level if momentum were to shift materially.
On momentum, TradingView places the 14-day relative strength index (RSI) at 46.2, a neutral reading that offers no clear directional conviction. The 14-day average directional index (ADX) reads 13.8, below the 15 threshold, indicating a weak and non-trending price environment at present.
To the downside, the classic pivot point at $2,132 sits just above the last price and now represents near-term overhead rather than support. The S1 level at $1,879 is the first classical support reference below the current price, with S2 at $1,654 as a secondary marker (TradingView, 2 April 2026).
This is technical analysis for informational purposes only and does not constitute financial advice or a recommendation to buy or sell any instrument.
Ethereum price history (2024–2026)
Ethereum launched via a crowdsale in mid-2014, and its mainnet went live in July 2015. ETH reached an all-time high of $4,878.26 in November 2021 before a prolonged bear market took hold through 2022–2023.
Opening April 2024 around $3,282, ETH/USD climbed steadily through spring and briefly touched $3,729.64 on 8 April 2024 before pulling back. The token traded in a broad $2,870–$3,900 range for most of Q2 and Q3 2024, dipping sharply to $2,116 on 5 August 2024 amid a wider crypto sell-off, then recovering to close the year at $3,331.81 on 31 December 2024.
In 2025, ETH started on firmer ground, closing at $3,353.92 on 1 January 2025 and pushing as high as $3,659.31 on 10 November before macro headwinds and sector rotation weighed on prices through year-end. The token ended 2025 near $2,967.68 on 31 December, down roughly 11% year on year.
The decline accelerated into 2026. ETH opened the year at $3,001.03 on 1 January 2026, briefly recovered above $3,368 in mid-January, then sold off sharply through February and March, touching an intraday low of $1,389.79 on 9 March 2026 before the more recent period. ETH closed at $2,033.04 on 2 April 2026, down approximately 32.2% year to date and approximately 38.9% year on year.
Past performance is not a reliable indicator of future results. Share prices are indicative and may differ from live market prices.
Capital.com analyst view: Ethereum
ETH entered 2026 at $3,001.03 before sliding sharply through Q1, recording a roughly 32% decline quarter on quarter and extending a six-month losing streak that only broke in March 2026, when the token gained approximately 7%, its strongest monthly performance since August 2025. The Q1 sell-off reflected a confluence of factors: five consecutive months of net outflows from spot Ethereum ETFs totalling over $2.4 billion per SoSoValue data, a high correlation with equity market volatility, and sustained macro uncertainty tied to U.S. trade policy and Federal Reserve rate guidance. On-chain fundamentals present a more mixed picture. Daily active addresses approached 788,000 in early April 2026 and the share of ETH held on centralised exchanges fell to approximately 11%, suggesting long-term holder retention. At the same time, leveraged positioning remained fragile, with $111 million in long liquidations triggered as prices broke below $2,000.
Near-term sentiment remains cautious, with bearish moving-average alignment and a neutral 14-day relative strength index offering no clear directional conviction as of 2 April 2026. A recovery in ETF inflows or a shift in Federal Reserve policy could support a rebound towards the $2,200–$2,400 range cited by several third-party models, while a sustained break below the $1,755 support level could open the way to a deeper move towards $1,500. At the same time, on-chain accumulation by large-wallet addresses and potential regulatory clarity around staked ETH products are structural factors that some analysts argue could support prices over a longer horizon, though macro headwinds and sector-wide risk appetite remain the dominant near-term variables.
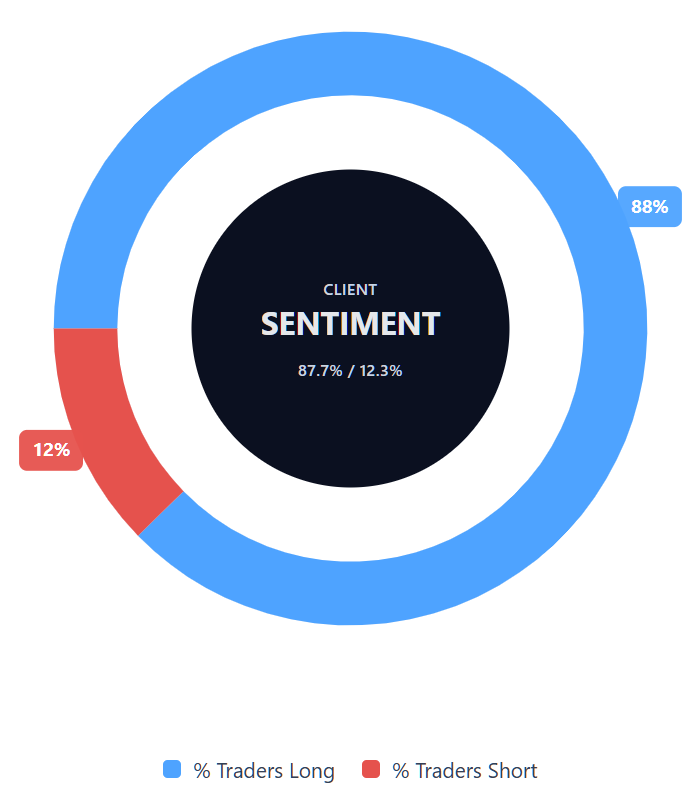
Capital.com’s client sentiment for Ethereum CFDs
As of 2 April 2026, Capital.com client positioning in Ethereum CFDs stands at 87.7% long and 12.3% short, which places it firmly in heavy-buy territory, with buyers ahead by 75.4 percentage points. This one-sided skew towards longs reflects a pronounced bullish lean among active participants at the time of capture. This snapshot reflects open positions on Capital.com and can change.
Summary – Ethereum (2026)
- ETH trades at $2,030.94 as of 12:57pm UTC on 2 April 2026, down roughly 32% year to date and approximately 39% year on year.
- Key drivers include five consecutive months of spot ETH ETF outflows, elevated U.S. trade policy uncertainty, Federal Reserve rate guidance, and ETH's high correlation with broader equity sentiment.
- ETH turned net inflationary following EIP-4844 fee reductions, reducing the burn rate and adding modest supply pressure to an already cautious demand backdrop.
Past performance is not a reliable indicator of future results.
FAQ
What is the latest Ethereum crypto price prediction?
Who owns the most Ethereum?
How much ether is there?
Could Ethereum’s price go up or down?
Should I invest in Ethereum?
Can I trade Ethereum CFDs on Capital.com?
Yes, you can trade Ethereum CFDs on Capital.com. Trading crypto CFDs lets you speculate on price movements without owning the underlying asset and to take long or short positions. However, contracts for difference (CFDs) are traded on margin, and leverage amplifies both profits and losses. You should ensure you understand how CFD trading works, assess your risk tolerance, and recognise that losses can occur quickly.