Ethereum price prediction: US–Iran peace talks lift crypto
Ethereum traded near the top of its intraday range on 14 April 2026 as crypto markets rose, with ETH also supported by stronger derivatives activity and improving risk sentiment. Explore third-party ETH price targets and technicals. Past performance is not a reliable indicator of future results.
Ethereum (ETH/USD) is trading at $2,387.29 as of 2:49pm UTC on 14 April 2026, near the top of the day’s $2,182.97–$2,393.65 intraday range. Past performance is not a reliable indicator of future results.
The move higher follows a broader crypto market rally, with Bitcoin surging more than 5% to a four-week high above $74,000 on 14 April 2026, amid optimism surrounding US–Iran peace talks (Yahoo Finance, 14 April 2026). ETH open interest had already spiked by approximately $2.2 billion in the wake of an earlier US–Iran ceasefire announcement on 8 April 2026, reflecting increased derivatives-driven demand, according to CryptoQuant data (Mitrade, 11 April 2026). Separately, markets continued to digest the impact of US tariff policy, with Trump's 'Liberation Day' baseline tariffs having triggered more than $400 million in crypto liquidations around 5 April 2026 before sentiment stabilised (Forbes, 5 April 2026). A softer macro backdrop and improved risk appetite also supported the recovery into mid-April (Yahoo Finance, 8 April 2026).
Ethereum price prediction 2026-2030: Analyst price target view
As of 14 April 2026, third-party ETH price predictions reflect a range of near-term outlooks shaped by technical indicators, derivatives activity, on-chain data, and the prevailing macro backdrop. The following targets summarise leading estimates for the Ethereum market from that period.
CoinCodex (5-day technical target)
CoinCodex estimates ETH could reach $2,278.54 within five days of its 30 March 2026 reference price of $2,069.81, implying a 10.92% rise. The model cites an RSI of 42.75 (neutral), a Fear and Greed Index reading of 8 (extreme fear), and key support levels at $1,947.05 and $1,877.38, while 82% of tracked technical indicators signalled a bearish stance at the time of capture (CoinCodex, 30 March 2026).
Phemex (Q2 2026 scenario analysis)
Phemex sets a bullish-case target of $2,500–$2,586 for Q2 2026, contingent on ETH holding the $2,106 support and posting a daily close above $2,350, while a bearish breakdown below $2,106 opens a path to $2,000, then $1,800. The analysis, published with ETH at $2,194.33 on 13 April 2026, flags a persistently negative MACD (-84.58) and a Connors RSI of 26.51 that indicate technically oversold conditions as the principal signals shaping the near-term range (Phemex, 13 April 2026).
Coinpedia (resistance and support zone outlook)
Coinpedia identifies $2,300–$2,400 as the key resistance band ETH must clear to confirm a recovery, with a break above that zone targeting $2,500+; a loss of $2,180–$2,200 support, by contrast, shifts the setup towards $2,050–$2,000. The outlet notes that daily active users stood at around 495,900 as of 12 April 2026, a recovery from mid-2024 lows but still below recent peaks, creating a divergence between price and on-chain fundamentals that may limit confidence in follow-through (Coinpedia, 13 April 2026).
Predictions and third-party forecasts are inherently uncertain, as they cannot fully account for unexpected market developments. Past performance is not a reliable indicator of future results.
ETH price: Technical overview
The ETH/USD price trades at $2,387.29 as of 2:49pm UTC on 14 April 2026, near the top of the day’s $2,182.97–$2,393.65 intraday range. Price sits above the short- to mid-term simple moving average cluster, with the 20-day and 50-day SMAs at roughly $2,139 and $2,099, both in buy alignment. However, the 100-day SMA at $2,345 and the 200-day SMA at $2,902 present a more mixed picture, with the 200-day SMA still a considerable distance above the current price.
The 20-over-50 alignment remains intact across the SMA family, which keeps the short-term structure constructive. The 14-day relative strength index sits at 64.9, in the upper-neutral band, while the moving average convergence/divergence (12, 26) registers a positive level of 59.4. Both readings are consistent with near-term positive momentum without signalling an overbought extreme. The average directional index at 17.8 suggests the trend lacks strong conviction at present.
On the topside, the classic R1 pivot at $2,357.0 has already been exceeded intraday; a sustained daily close above that level would put the R2 area near $2,610.6 in view. On pullbacks, the classic pivot point at $2,132.4 represents initial support, followed by the 100-day SMA level at $2,345, with S1 near $1,878.7 the next meaningful reference if the mid-range gives way (TradingView, 14 April 2026).
This is technical analysis for informational purposes only and does not constitute financial advice or a recommendation to buy or sell any instrument.
Ethereum price history (2024–2026)
ETH/USD’s price ended 2024 at $3,331.81 before carrying that momentum into early 2025, when ETH traded above $3,600 in the first week of January. A broad crypto sell-off then pulled the price lower through the first quarter, with ETH touching a two-year closing low of $1,669.97 on 9 April 2025 amid a sharp risk-off episode across digital assets.
A sustained recovery followed. ETH climbed steadily through the summer, reaching a dataset closing high of $4,527.93 on 8 October 2025, its strongest level in the two-year window. The rally faded into year-end, and ETH closed 2025 at $2,967.68, capping a year defined by a dramatic low-to-high swing of nearly 170%.
At the start of 2026, ETH briefly pushed higher, peaking near $3,368 intraday on 18 January before sellers reasserted control and the price fell back below $2,000 by late March. A recovery in early April has since brought ETH back above $2,390.
ETH closed at $2,390.04 on 14 April 2026, approximately 20.4% lower year to date but 47.2% higher year on year.
Past performance is not a reliable indicator of future results. Share prices are indicative and may differ from live market prices.
Capital.com analyst view: Ethereum
Ethereum’s price action over the past two years reflects the asset’s sensitivity to both macro conditions and its own evolving network fundamentals. ETH posted a sharp recovery from April 2025 lows near $1,670 to an October peak above $4,500, demonstrating meaningful upside potential when risk appetite and on-chain activity align. However, the subsequent reversal to current levels around $2,390, down roughly 20% year to date in 2026, illustrates how quickly sentiment can shift, particularly in an environment shaped by trade policy uncertainty and tighter liquidity conditions.
The network’s expanding role in real-world asset tokenisation and stablecoin infrastructure offers a structural case for longer-term relevance, though Ethereum also faces growing competitive pressure from rival layer-1 blockchains and persistent concerns around its inflationary supply dynamics. ETF flow data has remained a key watch point for institutional sentiment, with outflows presenting a headwind even as derivatives activity has shown signs of recovering demand. Neither the bullish nor bearish case is straightforward, and both narratives have credible supporting arguments at current price levels.
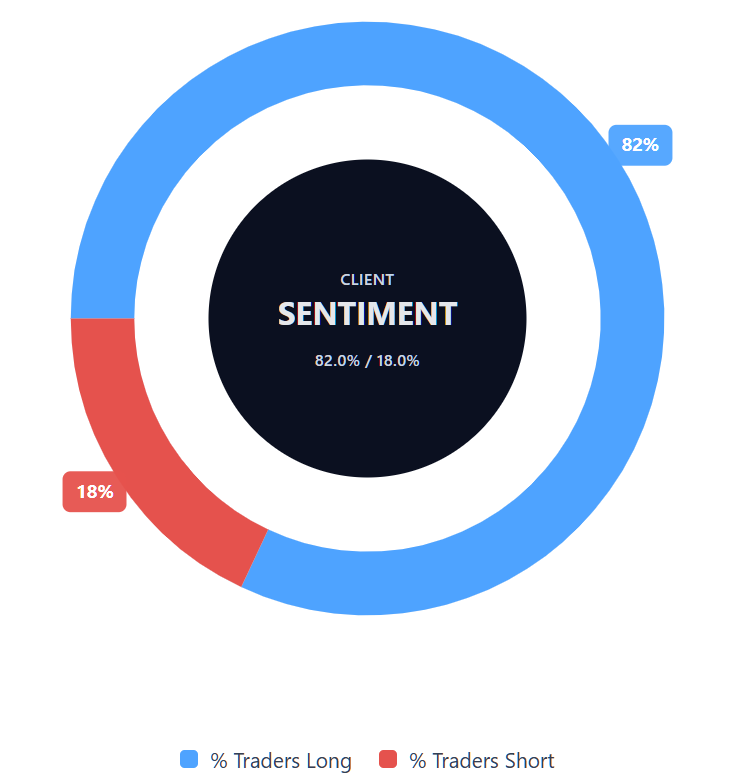
Capital.com’s client sentiment for Ethereum CFDs
As of 14 April 2026, Capital.com client positioning in Ethereum CFDs shows 82% buyers and 18% sellers, which puts buyers ahead by 64 percentage points and places sentiment firmly in heavy-buy, one-sided-towards-longs territory. This snapshot reflects open positions on Capital.com at the time of capture and can change rapidly as market conditions evolve.
Summary – Ethereum (2026)
- ETH trades at $2,387.29 as of 2:49pm UTC on 14 April 2026, down roughly 20% year to date but 47% higher year on year.
- Key drivers include US tariff policy uncertainty, broader crypto risk sentiment, Bitcoin correlation, and ETH-specific ETF flow data.
- Derivatives open interest has recovered, with net taker volume turning positive; a crypto rally linked to US–Iran peace talks lifted ETH sharply on 14 April 2026.
Past performance is not a reliable indicator of future results.
FAQ
What is the latest Ethereum crypto price prediction?
Who owns the most Ethereum?
How many Ethereum coins are there?
Could Ethereum’s price go up or down?
Should I invest in Ethereum?
Can I trade Ethereum CFDs on Capital.com?
Yes, you can trade Ethereum CFDs on Capital.com. Trading crypto CFDs lets you speculate on price movements without owning the underlying asset and to take long or short positions. However, contracts for difference (CFDs) are traded on margin, and leverage amplifies both profits and losses. You should ensure you understand how CFD trading works, assess your risk tolerance, and recognise that losses can occur quickly.