BASF stock forecast: BDO expansion at Ludwigshafen
BASF SE is a Germany-based chemicals group listed on the DAX, trading after publishing preliminary 2025 results and confirming plans to expand BDO output at Ludwigshafen ahead of its full annual report. Explore third-party BAS price targets and technical analysis.
BASF SE (BAS) is trading near €48.71 in intraday European dealings at 3pm (UTC) on 25 February 2026 , within a relatively narrow €48.59-€49.64 session range and broadly in line with recent February price levels. Past performance is not a reliable indicator of future results.
The stock trades following the release of preliminary 2025 figures indicating expected full-year sales of about €59.7bn, EBITDA before special items of €6.6bn, net income of €1.6bn and free cash flow of €1.3bn (Investing.com, 23 January 2026). BASF is due to publish its full BASF Report 2025 on 27 February 2026 (Financial Times, 22 January 2026). The backdrop also includes the company’s move to increase 1,4-butanediol (BDO) output at its Ludwigshafen site to support European supply security in downstream chemicals markets, placing additional focus on regional industrial demand and the resilience of integrated value chains (BASF, 16 February 2026).
BASF stock forecast 2026–2030: Third-party price targets
As of 25 February 2026, third-party BASF stock predictions indicate one-year objectives span €36–€52 range. Estimates vary as brokers apply different assumptions around European chemicals demand, energy costs, currency effects and policy support. All forecasts are conditional and may change as new information becomes available.
BASF (company consensus) (analyst estimates)
BASF reports an average 12-month target share price of about €48.89, based on external analyst estimates ranging from €36 to €62. The company states that these figures, compiled by an external provider, reflect differing assumptions on volumes, margins and regional growth across its chemicals, materials and agricultural businesses (BASF, 12 February 2026).
MarketScreener (consensus snapshot)
MarketScreener records a consensus BAS stock forecast of about €49.6, with individual analyst targets spanning approximately €36 to €62. The service notes a broadly positive tilt in recommendations, while acknowledging continued exposure to European industrial demand and energy-price volatility (MarketScreener, 17 February 2026).
Berenberg (broker upgrade)
Berenberg upgrades BASF from sell to hold and raises its target price from €38 to €48 per share. The broker refers to a shift in Europe’s political stance towards the chemicals sector, including potential support measures and anti-dumping actions. It also highlights valuation considerations and policy-delivery risks that could affect earnings momentum (Investing.com, 17 February 2026).
Simply Wall St (valuation-driven view)
Simply Wall St references a refreshed fair-value-style price target of €48.50 for BASF, describing the adjustment as a 'tune up rather than a rewrite' of its prior valuation. The analysis points to changes in discount-rate and revenue-growth assumptions as drivers of the revised figure, while emphasising that market prices can diverge from model-based estimates in cyclical sectors (Yahoo Finance, 9 February 2026).
MarketBeat (ADR target band)
MarketBeat reports that analysts covering BASF’s US-listed ADR (BASFY) cite a high price target of about $19.20, compared with a quoted level near $16 at the time. The note indicates that recent rating changes and higher trading volumes followed an upgrade-driven reassessment of earnings prospects. It also highlights the wide dispersion between high and low ADR targets, reflecting uncertainty around global chemicals demand and currency movements (MarketBeat, 18 February 2026).
Predictions and third-party forecasts are inherently uncertain, as they cannot fully account for unexpected market developments. Past performance is not a reliable indicator of future results.
BAS stock price: Technical overview
The BAS stock price is trading near €48.71 as of 3pm UTC on 25 February 2026, sitting just below the 10-day SMA around €49.8 and the 20-day SMA near €49.1. The broader 50-, 100- and 200-day SMAs sit lower at approximately €46.5, €45.0 and €44.2 respectively. The medium-term structure remains upward-sloping, as the 20-, 50-, 100- and 200-day averages continue to edge higher, even as price tests the shorter-term moving-average band and the 10-day EMA near €49.3 caps near-term upside attempts.
Momentum appears moderate rather than extended. The 14-day RSI sits near 54, in the upper-neutral range, while the ADX around 31 signals an established trend backdrop rather than a purely rangebound market.
On the upside, classic pivot resistance at R1 around €47.3 lies below the current price, placing R2 near €48.7 as the first nearby reference level. A sustained move above the current range could bring R3 near €52.1 into view. On pullbacks, the classic pivot around €45.3 marks initial support, with the 100-day SMA near €45 forming an additional technical shelf. A decisive break below that area could expose the S1 region near €44.0 (TradingView, 25 February 2026).
This technical analysis is provided for informational purposes only and does not constitute financial advice or a recommendation to buy or sell any instrument.
BASF share price history (2024–2026)
Over the past two years, BAS’s stock price has largely traded within a broad €40-€55 range, with extended periods in the low to mid €40s and intermittent rallies into the €50s. The stock traded around €47-€49 in late February 2024, closing at €47.30 on 29 February 2024, before rising into the low €50s during March and early April 2024. It later eased back into a tighter €42-€46 range through the summer and autumn of 2024.
In early 2025, BASF continued to fluctuate in the low to mid €40s, briefly dipping below €42 in April 2025 before gradually recovering. From mid-2025, the price established a steadier upward trajectory, moving from the low €40s towards the high €40s. By late 2025, the share price traded mainly around €43-€45. Into early 2026, it moved higher again, closing at €48.74 on 25 February 2025 and €48.87 on 25 February 2026, leaving the stock modestly higher year on year and nearer the upper boundary of its recent two-year range.
Past performance is not a reliable indicator of future results. Share prices are indicative and may differ from live market prices.
BASF (BAS): Capital.com analyst view
BASF’s share price has moved from the low €40s to the high €40s over the past year, shifting from a relatively compressed trading range in 2024 to levels closer to the upper end of its two-year band in early 2026. This change coincides with a reassessment of European cyclical sectors, as market participants weigh preliminary 2025 results and cost measures against ongoing uncertainty around energy prices, industrial production and global demand for downstream chemicals.
If the price holds near the high €40s, some market participants may interpret this as a sign that expectations for margin stability and cash-flow generation are becoming more anchored, particularly if policy support for energy-intensive industries progresses. However, BASF’s earnings remain sensitive to global manufacturing trends, input costs and currency effects. A weaker macroeconomic backdrop or renewed volatility in energy markets could alter valuation assumptions and increase downside risk.
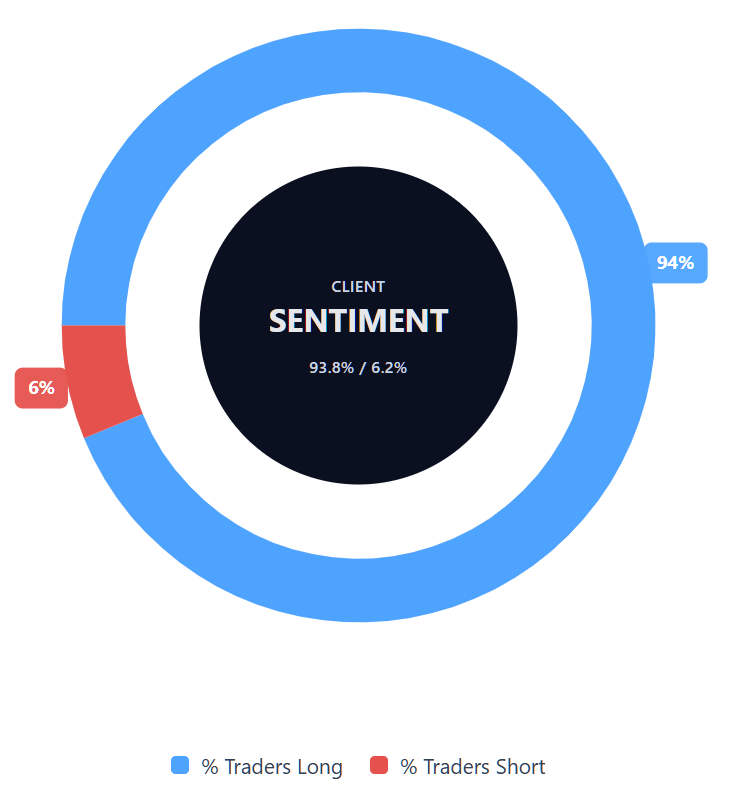
Capital.com’s client sentiment for BASF CFDs
As of 25 February 2026, Capital.com client positioning in BASF CFDs shows a pronounced long bias, with 93.8% of open CFD positions on the buy side and 6.2% on the sell side. This distribution reflects current client positioning on the platform and does not indicate future price direction. Sentiment can shift as traders adjust exposure in response to price moves and new information.
Summary – BASF 2026
- As of 3pm UTC on 25 February 2026, BASF trades near €48.71, towards the upper end of its approximate €40-€55 two-year range.
- Daily technical indicators show price testing short-term moving averages in the high €40s, with RSI near 54 and ADX indicating an established but not extreme trend environment.
- Key variables include European industrial demand, chemicals margins, energy and feedstock costs, currency movements and the evolution of EU policy support for energy-intensive sectors.
- Recent developments centre on preliminary 2025 financial results, free cash flow generation, portfolio measures and selected capacity increases in key intermediates, alongside broader discussions around policy and cyclical demand conditions.
Past performance is not a reliable indicator of future results.
FAQ
Who owns the most BASF stock?
BASF SE has a broad institutional shareholder base, with large global asset managers and European investment funds typically holding significant positions. As a DAX-listed company, its shares are widely held by institutional investors, pension funds and retail shareholders, rather than being controlled by a single dominant owner. The exact distribution can change over time as funds rebalance portfolios or adjust sector exposure, so investors often consult the latest annual report or regulatory filings for up-to-date ownership data.
What is the five-year BASF share price forecast?
There is no single agreed five-year BAS stock forecast. Most published analyst targets focus on a 12-month horizon, with February 2026 estimates clustered in the high €40s to low €50s. Longer-term projections depend on assumptions about global chemicals demand, energy and feedstock costs, currency movements, capital allocation and European industrial policy. Forecasts beyond one year typically involve greater uncertainty and may be revised as macroeconomic and company-specific conditions evolve.
Is BASF a good stock to buy?
Whether BASF is considered a ‘good’ stock depends on an individual’s objectives, time horizon and risk tolerance. The company operates in cyclical chemicals markets, which can expose earnings to swings in industrial demand, input costs and global trade conditions. Some market participants assess valuation metrics, cash flow and restructuring measures, while others focus on sector volatility and macroeconomic risks. This article provides information for educational purposes only and does not constitute investment advice.
Could BASF stock go up or down?
BASF’s share price can move in either direction, influenced by company results, changes in chemicals margins, energy and feedstock costs, currency fluctuations and broader economic data. Technical factors, such as momentum indicators and support or resistance levels, may also shape shorter-term price action. Market sentiment and investor positioning can amplify moves in both directions. As with all equities, past performance is not a reliable indicator of future results, and price volatility should be considered.
Should I invest in BASF stock?
Deciding whether to invest in BASF shares requires careful consideration of your financial goals, risk appetite and broader portfolio strategy. BASF’s earnings profile reflects exposure to global industrial cycles and policy developments in Europe, which can create both upside potential and downside risk. It is important to assess factors such as valuation, balance sheet strength and sector outlook in context. This content is for general information only and should not be taken as a recommendation.
Can I trade BASF CFDs on Capital.com?
Yes, you can trade BASF CFDs on Capital.com. Trading share CFDs lets you speculate on price movements without owning the underlying asset and to take long or short positions. However, contracts for difference (CFDs) are traded on margin, and leverage amplifies both profits and losses. You should ensure you understand how CFD trading works, assess your risk tolerance, and recognise that losses can occur quickly.