
Fisher transform indicator: formula, settings and strategies
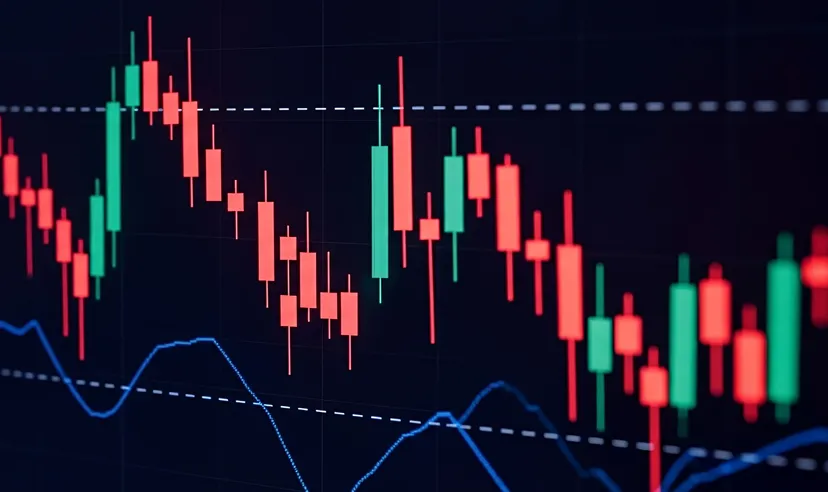
The fisher transform indicator reshapes price data so potential turning points may be easier to see than they are on a standard price chart. Traders use it to read stretched market conditions, signal-line crossovers and divergence, but it can also produce readings that price does not later confirm.
Key takeaways
- The fisher transform indicator converts normalised price into a sharper curve to help highlight potential turning points.
- It was developed by engineer and trader John F. Ehlers and introduced in his 2002 article ‘Using the Fisher Transform’.
- It is usually shown with a signal line, which traders use to watch for crossovers.
- The core formula is 0.5 multiplied by the natural log of (1 + X) over (1 − X).
- Common settings range from a five-period lookback for short timeframes to 13 or more for longer-term trading.
- Traders often pair it with a trend filter, RSI, volume tool or support and resistance.
- No indicator removes risk, and past performance is not a reliable indicator of future results.
What is the fisher transform indicator?
The fisher transform indicator is a technical oscillator that reshapes price data to make stretched market conditions easier to read. Price often spends much of its time near the middle of a recent range. This can make potential turning points harder to spot. The fisher transform pulls the outer points further apart, creating clearer peaks and troughs on the indicator.
It was created by John F. Ehlers, an engineer who applied signal-processing techniques to financial markets and published the method in 2002. His idea was that most price data does not follow a neat bell-shaped, or Gaussian, distribution. By reshaping the data into a more bell-curve-like form, the indicator aims to make potential reversal zones more visible (Wiley Online Library, accessed 2 July 2026).
The fisher transform is usually shown in a separate panel below the price chart. It typically includes:
- A faster Fisher line.
- A slower signal line.
- A zero line, used as a broad reference point.
Fisher transform at a glance
| Feature | What it means |
|---|---|
| Indicator type | Technical oscillator |
| Main use | Identifying potential turning points and stretched conditions |
| Common display | Separate chart panel below price |
| Key lines | Fisher line, signal line and zero line |
| Typical readings | Crossovers, extremes and divergence |
| Main limitation | Can produce false or early readings, especially in choppy markets |
How is the fisher transform indicator calculated?
The calculation has two main stages:
- Price is normalised into a value between −1 and +1 based on its recent range.
- That value is passed through the fisher transform formula, which creates sharper peaks and troughs.
The normalisation step uses the median price, which is the average of the high and low for each candle. It compares that value with the highest high and lowest low over the chosen lookback period:
This places X somewhere between −1 and +1. Ehlers applied light exponential smoothing to this value, with a weighting of approximately 0.33 in his original formulation, though implementations may vary. The value is then clamped to roughly −0.999 to +0.999 so the next step does not become undefined.
The transform itself is:
Here, ln means the natural logarithm. As X moves closer to its upper or lower limits, the Fisher value rises or falls more sharply. This is what turns gradual price swings into more visible indicator peaks and troughs.
A signal line, usually the previous bar’s Fisher value, is plotted alongside it for crossovers.
Past performance is not a reliable indicator of future results.
Worked fisher transform example
Consider a hypothetical FTSE 100 chart using a 10-period lookback.
| Input | Value |
|---|---|
| Highest high over 10 candles | 7,500 |
| Lowest low over 10 candles | 7,300 |
| Current median price | 7,470 |
| Raw position in range | 0.85 |
| Normalised X value | 0.70 |
| Approximate Fisher reading | 0.87 |
The raw position in the range is:
Doubling and recentring gives:
Feeding that into the formula gives:
In this illustrative scenario, the reading would show the market sitting high in its recent range. It would not, on its own, show what price may do next.
Past performance is not a reliable indicator of future results.
How traders read the fisher transform
Because the formula highlights extremes, the fisher transform indicator often stays near the centre before moving sharply when price reaches the edge of its recent range. Traders may read those moves as signs that a market is becoming stretched and could be nearing a turning point.
Common fisher transform readings
| Reading | How some traders interpret it | Key limitation |
|---|---|---|
| Fisher line above zero | Price may be trading high in its recent range | It does not confirm that price will keep rising |
| Fisher line below zero | Price may be trading low in its recent range | It does not confirm that price will keep falling |
| Fisher line crosses above signal line | Downside momentum may be easing | The crossover can appear early or fail |
| Fisher line crosses below signal line | Upside momentum may be slowing | The reading may not be followed by price |
| Extreme high or low reading | The market may be stretched | Strong trends can stay stretched for longer |
| Divergence with price | Momentum may be weakening | Divergence can continue without a price reaction |
A reading well above zero may suggest the market is trading high in its recent range, which some traders interpret as a potentially overbought condition. A reading well below zero may suggest the market is trading low in its recent range, which is often read as a potentially oversold condition.
Best fisher transform settings for different trading styles
The lookback period controls how sensitive the indicator is. A shorter setting reacts faster and gives more readings. A longer setting smooths the curve and gives fewer readings. There’s no universally best setting. The right choice depends on the timeframe, instrument and level of noise a trader is willing to accept.
Short-term and intraday trading: around five periods
For shorter-term approaches, such as day trading, a setting of around five periods may suit traders on lower timeframes who want quicker reactions. It can identify potential turning points earlier, but it may also create more frequent readings and more noise. The main trade-off is that price may not always follow through after a signal. For that reason, some traders use a confirmation tool alongside the fisher transform.
Swing trading: around nine to 10 periods
Ehlers’ original work referenced a nine or 10-period setting, and many swing traders stay close to this range. It can offer a balance between responsiveness and smoothness, especially on daily charts. This range may help filter out some of the noise that a five-period setting would capture. However, signals can still arrive early or late, depending on market conditions.
Position and longer-term trading: 13 periods or more
For longer-term approaches, such as position trading, A setting of 13 periods or more slows the indicator down. It produces fewer readings and tends to ignore smaller swings, which may suit traders holding positions over several weeks. The main trade-off is that potential turning points may appear later. This can make the indicator less responsive, but may help traders focus on broader price moves rather than short-term noise.
Core fisher transform indicator trading strategies
Traders use the fisher transform indicator in several common ways. Each approach below is for educational purposes only and is not investment advice or a recommendation to trade in any particular way.
| Strategy | What traders look for | What to watch out for |
|---|---|---|
| Signal line crossover | Fisher line crossing above or below the signal line | Crossovers can appear before price confirms the move |
| Zero-line crossover | Fisher line moving above or below zero | This can lag faster crossover signals |
| Extreme reversal reading | A high or low reading turning back towards zero | Strong trends can remain stretched |
| Trend-filtered entries | Fisher readings aligned with a broader trend filter | Filters can reduce some noise but cannot remove risk |
| Divergence | Price and indicator moving in opposite directions | Divergence can persist without price reacting |
- Signal line crossover. The fisher line crosses above or below its signal line. A cross above in negative territory may suggest easing downside momentum, while a cross below in positive territory may suggest easing upside momentum. Some traders wait for a closed bar to confirm the crossover.
- Zero-line crossover. The fisher line moves above or below zero. A move into positive territory may support an emerging uptrend reading, while a move into negative territory may suggest the opposite. This can lag signal-line crossovers but may filter out shorter-term swings.
- Extreme reversal reading. The fisher reaches a high or low reading, then turns back towards zero. This may suggest momentum is easing, but the indicator can stay stretched in strong trends.
- Trend-filtered entries: Fisher readings are used only when they align with a broader trend filter, such as a moving average. This may reduce readings against the prevailing direction, but it can’t remove risk.
The fisher transform indicator can produce readings that price doesn’t later confirm, particularly in choppy or range-bound conditions. Past performance is not a reliable indicator of future results.
Combining the fisher transform with other indicators
Because the fisher transform can generate frequent readings, traders often pair it with a complementary tool for extra context. None of these combinations removes the risk of a reading that price does not follow.
Moving averages
A moving average can act as a directional filter. A trader might treat a bullish Fisher reading as more relevant when price is above the average, and a bearish reading as more relevant when price is below it. This can help screen out readings that run against the broader direction.
Relative strength index
The relative strength index (RSI) is another momentum measure. When both the fisher transform and RSI reach stretched readings at the same time, some traders view the combined picture as providing additional context. If they disagree, it may prompt caution.
Volume measures
Pairing the indicator with a volume study can show whether a potential turn is accompanied by rising participation. A Fisher reading that turns while volume expands may be read differently from one that turns on thin activity, though volume does not confirm an outcome on its own.
Support and resistance
Mapping Fisher readings against support and resistance levels can add structure. A stretched reading that lines up with a well-tested level may provide more context than one occurring in open space, where there is less nearby structure to react against.
Common mistakes when using the fisher transform
Some fisher transform mistakes come from treating the indicator as a standalone signal rather than a tool for reading momentum. Here are a few common issues to watch for:
- Treating every spike as a reversal: the fisher transform can stay stretched during strong trends, so spikes don’t always signal an imminent turn.
- Using it in isolation: the indicator can flip back and forth in choppy markets, so traders often use it with a trend filter or second tool.
- Ignoring the timeframe: the same setting can behave very differently on intraday, daily or weekly charts.
- Forgetting the smoothing lag: smoothing reduces noise, but it can also mean a reading is partly reflected in price already.
Past performance is not a reliable indicator of future results.
Create an account Open a demo account
FAQ
What is the fisher transform indicator used for?
The fisher transform is a momentum oscillator that reshapes price data to make potential turning points easier to read. By stretching out extreme values, it aims to highlight moments when a market may be sitting unusually high or low within its recent range. Traders generally use it as context for assessing momentum rather than as a standalone reason to act.
What is the best setting for the fisher transform?
There is no universally best setting. John Ehlers referenced a 9 or 10-period lookback, and many traders stay close to this on daily charts. Shorter periods of around five react faster but produce more readings, while periods of 13 or more are slower and steadier. Testing a setting on a demo account can show how it behaves before a trader uses it in live conditions.
Who created the fisher transform?
The fisher transform was developed by John F. Ehlers, an engineer who applied signal-processing methods to financial markets and published the method in a 2002 article. He introduced it in his work on cycle analysis, arguing that most price data does not follow a neat bell-shaped distribution. The transform reshapes that data into a more bell-curve-like form so potential reversal zones may become easier to see.
Is the fisher transform a leading or lagging indicator?
It is generally described as a leading oscillator because it can react before a move is fully established. That responsiveness is one reason traders use it. The light smoothing built into the calculation does add a small delay, however, and the indicator can produce readings that price does not follow through on, especially in range-bound conditions.

