Eni stock forecast: Buyback and Searah JV
Eni is an Italian energy company listed on the Borsa Italiana, with recent focus on its €2.8bn buyback and Searah joint venture with Petronas. Explore third-party ENI price targets and technical analysis. Past performance is not a reliable indicator of future results.
Eni S.p.A. (ENI) is trading at €20.50 in early European trading as of 11:36am UTC on 25 June 2026, within an intraday range of €20.38–€21.47. Past performance is not a reliable indicator of future results.
At the corporate level, Eni's ongoing €2.8 billion share buyback programme, expanded from €1.5 billion in March 2026, continues to provide structural support (Caliber.az, 24 April 2026). The company has acquired 20,028,482 treasury shares, or 0.66% of share capital, for approximately €460 million since the programme began on 8 May 2026 (Eni 24 June 2026). Meanwhile, the June 2026 establishment of Searah, Eni's 50/50 joint venture with Petronas targeting more than 300,000 barrels of oil equivalent per day across Indonesia and Malaysia, marks a longer-term operational development noted in market coverage (Megaproject, 8 June 2026).
Third-party Eni outlook: buyback support as crude view resets
As of 25 June 2026, third-party Eni stock predictions remain broadly constructive, supported by the company's expanded buyback programme, Brent crude exposure and upstream production growth.
Investing.com UK (multi-broker consensus)
Investing.com UK aggregates 22 analyst estimates on the Borsa Italiana-listed shares (ENI) and reports an average 12-month price target of €25.40, with estimates ranging from €19–€30. The consensus rating is Buy, with nine buy recommendations, 12 holds and one sell. The range points to differing assumptions around Brent crude's trajectory and the pace of Eni's satellite company monetisation programme (Investing.com UK, 18 June 2026).
MarketBeat (Wall Street consensus – NYSE ADR)
MarketBeat compiles ratings from 13 Wall Street analysts covering Eni's NYSE-listed ADR (NYSE: E) and reports a consensus 12-month price target of $42.30, with estimates spanning $28–$64.30. The aggregate rating is Moderate Buy, comprising two strong buy, six buy and five hold recommendations. The consensus target represents a downside of approximately 10.3% from the ADR's 24 June 2026 closing price of $47.16, with the wide range reflecting differing assumptions on oil price normalisation and refining margins (MarketBeat, 24 June 2026).
MarketScreener (broker consensus – Borsa Italiana)
MarketScreener aggregates broker recommendations on the Borsa Italiana listing and reports a mean 12-month consensus price target of €25.40 against a last close of €21.64, implying approximately 17.4% upside to the average target. The mean consensus rating is Outperform, based on 22 contributing analysts. The gap between the consensus target and the current trading level is partly linked to the market's reassessment of Brent prices following the de-escalation of Middle East tensions earlier in 2026 (MarketScreener, 24 June 2026).
The Globe and Mail – J.P. Morgan (single-broker view)
The Globe and Mail reports that J.P. Morgan analyst Matthew Lofting maintained a Buy rating on Eni S.p.A. with an unchanged price target of €28. The bank retains a constructive view amid Eni's upstream production momentum and expanded €2.8 billion buyback programme, which Lofting had previously cited as a key capital return signal following the company's Q1 2026 results (The Globe and Mail, 19 June 2026).
The Globe and Mail – UBS (single-broker view)
The Globe and Mail reports that UBS analyst Joshua Stone maintained a Buy rating on Eni S.p.A. with a price target of €29, the highest single-broker target in the current window. The maintained Buy rating reflects UBS's view on Eni's capital discipline and quality upstream spending, a stance the bank first initiated in November 2025 when it upgraded the stock from Neutral to Buy (The Globe and Mail, 17 June 2026).
Predictions and third-party forecasts are inherently uncertain, as they cannot fully account for unexpected market developments. Past performance is not a reliable indicator of future results.
Eni S.p.A. earnings: latest results and next release
Eni reported its most recent quarterly results on 24 April 2026, covering the three months to 31 March 2026. Adjusted net profit came in at €1.3 billion, missing consensus forecasts due to refining weakness and adverse foreign exchange movements, while pro forma adjusted EBIT reached €3.5 billion. Hydrocarbon production grew 9% year on year to 1.8 million barrels of oil equivalent per day, and cash flow from operations before working capital movements totalled €2.9 billion (Eni, 24 April 2026). FurtherAfrica notes that, alongside the results, Eni raised its full-year cash flow guidance by 20% to €13.8 billion and nearly doubled its 2026 share buyback programme to €2.8 billion, citing confidence in ongoing cash generation (FurtherAfrica, 28 April 2026).
The next scheduled release is the Q2 2026 results, covering the three months to 30 June 2026. MarketScreener lists the earnings release date as 29 July 2026, preceded by a Board of Directors meeting on 28 July 2026, with an earnings presentation also scheduled for 29 July 2026 (MarketScreener, 24 June 2026). Investing.com UK separately records the next report date as 29 July 2026, with a consensus EPS estimate of €0.752 for the Q2 period, against revenue forecasts of approximately €28.97 billion (Investing.com UK, 18 June 2026).
Past performance is not a reliable indicator of future results. Earnings estimates are third-party consensus projections and do not constitute financial advice.
ENI stock price: technical overview
The ENI stock price trades at €20.50 as of 11:36am UTC on 25 June 2026, below its short- and medium-term moving average cluster. The 20-, 50-, 100- and 200-day SMAs stand at approximately €22.47, €22.92, €22 and €18.91, respectively, according to TradingView data. The stock is currently below the 20-, 50- and 100-day SMAs, but remains above the 200-day SMA near €18.91.
The Hull moving average (9) prints at €20.83, just above the current price, while the 100-day EMA at €21.61 offers a nearby overhead reference. The 200-day EMA at €19.72 sits closer to current levels than its SMA equivalent and may serve as a near-term reference if the downward drift extends.
Momentum indicators lean bearish at this snapshot. The 14-day RSI reads 29.25, placing the stock in oversold territory on TradingView’s oscillator suite, while the average directional index (14) at 21.29 suggests a moderately established trend rather than a weak or directionless move.
On the classic pivot framework, the pivot point (P) at €23.03 represents overhead resistance, with R1 at €23.84 in view of a sustained recovery towards that zone. To the downside, S1 at €21.72 has already been breached; S2 near €20.91 sits just above the current price, while S3 at €18.79 aligns broadly with the 200-day SMA shelf near €18.91 (TradingView, 25 June 2026).
This is technical analysis for informational purposes only and does not constitute financial advice or a recommendation to buy or sell any instrument.
Eni share price history (2024–2026)
ENI’s stock price opened June 2024 trading in the mid-€14s before drifting lower through the second half of the year, closing 2024 at €13.10 on 30 December. The stock had been weighed down by softer crude prices and a broader reassessment of European energy valuations, with Brent retreating from earlier highs.
ENI began 2026 at €16.44 on 2 January, having spent much of 2025 rangebound in the €13–€14 corridor before a steady recovery gathered pace into year-end. A sharper re-rating followed in early 2026, with the shares climbing through February and March as Brent crude rose on supply concerns linked to the Iran conflict. The stock reached a near-term peak of €25.06 on 7 April 2026 before pulling back as the macro backdrop shifted.
From that April high, ENI has declined materially, moving lower through May before accelerating in June and closing at €20.44 on 25 June 2026. That marks a fall of approximately 18.5% from the 7 April peak, though the stock remains up roughly 24.3% year to date and approximately 48.3% year on year from €13.77 on 25 June 2025.
Past performance is not a reliable indicator of future results. Share prices are indicative and may differ from live market prices.
Eni (ENI): Capital.com analyst view
ENI’s 2026 price performance has been shaped by a sharp rally followed by a meaningful correction. The shares climbed from €16.44 at the start of January to a peak near €25.06 in early April, supported by higher Brent crude prices amid the Iran conflict and Eni’s decision to nearly double its share buyback programme to €2.8bn. The company also raised full-year cash flow guidance to €13.8bn.
Those same oil-price tailwinds carry risk. A de-escalation of Middle East tensions or a faster-than-expected increase in OPEC+ supply could put renewed pressure on Brent and, by extension, ENI’s revenues and cash generation.
Since the April peak, the stock has retreated to around €20.50 and now trades below most short-term moving averages as the market reassesses the crude price outlook. On the constructive side, Eni’s ongoing buyback activity, 9% year-on-year upstream production growth in Q1 2026 and a broadly Buy-rated consensus with an average 12-month target of €25.40 across 22 analysts suggest some market participants view the pullback as a reset rather than a structural reversal.
However, the risks remain material. ENI’s Q1 adjusted net profit of €1.3bn missed forecasts, while further softness in oil or gas prices, or execution risk around satellite company monetisation, could weigh on that thesis.
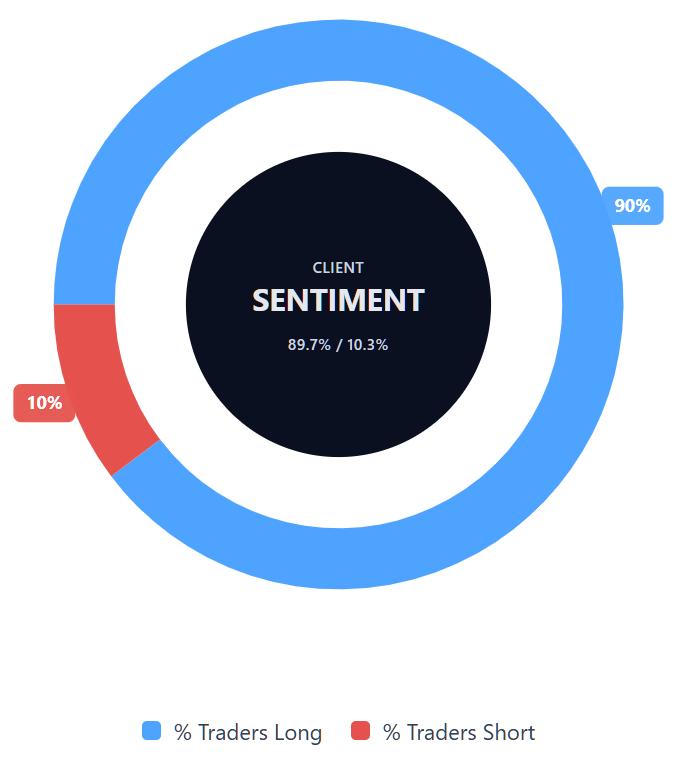
Capital.com’s client sentiment for Eni CFDs
As of 25 June 2026, Capital.com client positioning in Eni CFDs stands at 89.7% buyers vs 10.3% sellers, putting buyers ahead by 79.4 percentage points. This shows a strong long bias among Capital.com clients with open positions in the stock. The snapshot can change.
Summary – Eni 2026
- ENI trades at €20.50 as of 11:36am UTC on 25 June 2026, down from an April peak of €25.06 but up roughly 24% year to date.
- Key price drivers include Brent crude’s trajectory, the outcome of Middle East tensions following the Iran conflict and Eni’s expanded €2.8bn share buyback programme, which has been running since May 2026.
- Eni’s Q1 2026 adjusted net profit of €1.3bn missed consensus estimates, though hydrocarbon production grew 9% year on year and full-year cash flow guidance was raised to €13.8bn.
- Recent news includes Eni’s ongoing treasury share repurchases, with 20m shares acquired as of 19 June 2026, and the launch of the Searah joint venture with Petronas in June 2026.
Past performance is not a reliable indicator of future results.
FAQ
Who owns the most ENI stock?
What is the five-year ENI share price forecast?
Is ENI a good stock to buy?
Could ENI stock go up or down?
Should I invest in ENI stock?
Can I trade ENI CFDs on Capital.com?
Yes, you can trade Eni CFDs on Capital.com. Trading share CFDs lets you speculate on price movements without owning the underlying asset and to take long or short positions. However, contracts for difference (CFDs) are traded on margin, and leverage amplifies both profits and losses. You should ensure you understand how CFD trading works, assess your risk tolerance, and recognise that losses can occur quickly.