

US midterms: the end of uncertainty could give Wall Street direction
Markets dislike uncertainty and volatility tends to rise ahead of the vote, but once the results are known, indices may be able to set a clearer direction.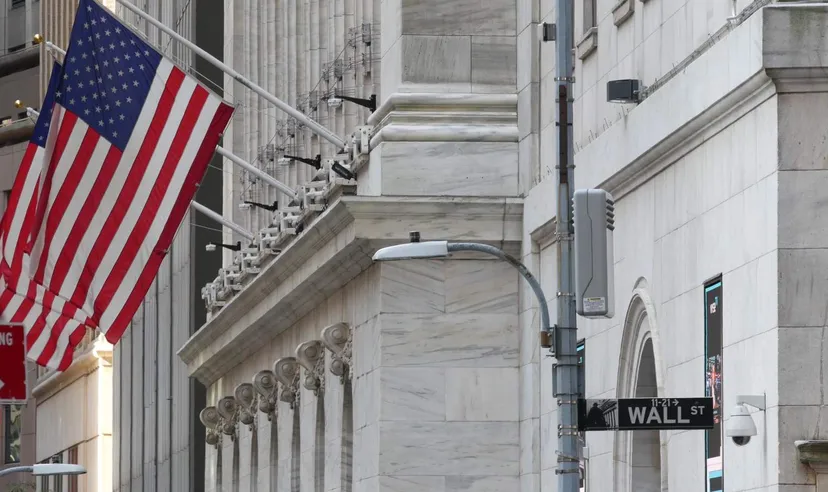
What is at stake on 3 November
All 435 seats in the House of Representatives and 35 of the 100 Senate seats are up for election. The vote comes at a difficult time for the White House: the war with Iran, which began in February, has severely restricted traffic through the Strait of Hormuz, gasoline was 34.2% more expensive in September than a year earlier, according to the Bureau of Labor Statistics, and Donald Trump's approval rating has fallen to record lows.
Prediction markets give Democrats a clear advantage. On Polymarket, as of 22 October, the probability of a Democratic victory in both chambers was 68%, that of a divided Congress, with Democrats in the House and Republicans in the Senate, was 24%, and that of Republicans holding both chambers was just 9%. Decision Desk HQ gives Democrats a 77% chance of winning the House.
Macroeconomic backdrop: inflation rising, jobs cooling
Indices head into the elections against a demanding macroeconomic backdrop. Inflation has picked up again on the back of energy, the labour market has lost momentum and the Fed has already resumed raising rates. It is an unusual combination, leaving equities exposed both to the risk of higher rates and to a slowdown in earnings.
| Indicator | Latest reading | Comment |
|---|---|---|
| Inflation (CPI, year-on-year) | 3.7% (Sep) | Accelerating with gasoline, up 34.2% in a year |
| Core inflation (CPI) | 2.6% (Sep) | Above the 2.5% expected |
| PCE / core PCE | 3.4% / 3.0% (Aug) | The Fed's preferred gauge |
| GDP (annualised rate) | 2.2% (Q2) | Q3 estimate due on 29 October |
| Unemployment rate | 4.2% (Sep) | Up from 4.1% in August |
| Job creation (payrolls) | +29k (Sep) | Well below the 84k expected |
| Wages (year-on-year) | 3.0% (Sep) | Growing more slowly than inflation |
| Fed funds rate | 3.75%–4.00% | 25bp hike in September |
| 10-year Treasury yield | ~5.0% | Touched 5.35%, highest since 2002 |
| Brent | ~USD 113–115 | Five-month high on Iran tensions |
Sources: Bureau of Labor Statistics, Bureau of Economic Analysis, Federal Reserve and market data. Latest data available as of 23 October 2026.
Past performance is not a reliable indicator of future results.
With wages growing 3.0% and prices 3.7%, household purchasing power is shrinking, a central theme in the campaign. For equities, the challenge is twofold: high rates weigh on the valuations of growth companies, while the cooling labour market threatens the earnings of companies most dependent on domestic consumption, many of them in the Russell 2000. On 29 October, the first estimate of third-quarter GDP and September PCE data will be the last major numbers before the vote.
Markets dislike uncertainty
History shows that the election outcome matters less than the uncertainty that precedes it. JPMorgan expects higher volatility up to election day, and options data compiled by Barclays point to a move of around 0.8% in the S&P 500 on 4 November, the day after the vote.
Volatility is already evident. The S&P 500 hit record highs on 9 October, but the week of 12–16 October was marked by heavy selling in technology. The Nasdaq 100 (US100) fell about 5.5% over that period, its worst week since April 2025, with selling concentrated in semiconductors and companies linked to artificial intelligence. According to Goldman Sachs data, hedge funds cut their exposure to technology at the fastest pace since at least 2016. The S&P 500 lost almost 2% over the same period, its biggest weekly drop since June. Selling returned on 22 October after results from Meta and Tesla: the Nasdaq 100 (US100) fell almost 3% and the S&P 500 lost 1.2%.
The Russell 2000, the index of small and mid-sized companies, was hit even harder. On 14 October it entered correction territory, around 11% below its August high. Smaller companies are more sensitive to interest rates because they carry more debt, a larger share of it at floating rates, which makes them particularly vulnerable to the prospect of further Fed hikes. Once the results are known, the market will be able to assess the direction of fiscal, regulatory and trade policy more clearly, which tends to make it easier to pick a direction.
Three election scenarios and the impact on indices
For equities, what matters more than who wins is how each outcome changes expectations for taxes, regulation and public spending. Probabilities are from Polymarket as of 22 October.
SCENARIO 1 · REPUBLICANS HOLD BOTH CHAMBERS · 9%
This would be the biggest surprise relative to the polls. The market would read the outcome as continuity of current policies, with more room for tax cuts, deregulation and a sustained pace of investment in artificial intelligence. In the short term, it could favour Russell 2000 small caps, banks and energy, and could even fuel an initial speculative rally. However, the prospect of more spending could deepen fiscal concerns and push yields higher, limiting gains for technology stocks with more demanding valuations.
SCENARIO 2 · DEMOCRATS WIN THE HOUSE, REPUBLICANS KEEP THE SENATE · 24%
This is the divided Congress that several investment banks see as their base case. New fiscal measures would be blocked, but trade policy and much of regulation would remain in the hands of the White House. Historically, political gridlock has not hurt equities: according to JPMorgan, the S&P 500 gained an average of 21% in the two years following elections that produced a divided Congress, compared with 18% under single-party control. The main risk would be a standoff over government funding and the debt ceiling in 2027.
SCENARIO 3 · DEMOCRATS WIN BOTH CHAMBERS · 68%
This is the most likely scenario according to prediction markets and is therefore already partly reflected in prices. A Democratic Congress would bring more scrutiny of the administration and of Big Tech, which could trigger volatility in the Nasdaq 100 immediately after the vote. On the other hand, a lower likelihood of new debt-financed spending could ease long-term yields, a supportive factor for equity valuations.
Stocks: AI technology companies in the spotlight
To understand where indices are heading, you need to look at the stocks that carry the most weight in them. In early October, the Magnificent Seven accounted for around 35% of the S&P 500 but only about 26% of expected earnings over the next 12 months, and traded at an average of around 23 times forward earnings, compared with 17 times for the rest of the index. With this degree of concentration, any shift in sentiment towards artificial intelligence weighs more on indices than the election result itself.
Performance within the group has been very uneven in 2026. By 20 October, Apple and Nvidia were up around 25%, Tesla was down about 17% and the seven as a whole had gained about 11%. The recent selling in semiconductors shows that the market no longer rewards all AI-linked companies equally: after very strong gains, attention has shifted to the cost of investment, debt levels and the ability to generate returns.
The elections could affect these companies in three ways:
Chip exports to China. Export policy has been set mainly by the White House, but Congress wants a say. A bipartisan House proposal, the AI Overwatch Act, would give Congress the power to review and block sales of advanced chips. A Congress with more leverage over the administration could tighten that scrutiny, a risk for chipmakers such as Nvidia and AMD. On top of this comes competition from China itself: according to IDC, Nvidia's share of China's data centre AI chip market fell to 34% in the first half of the year, with Huawei already at 28%, as Beijing encourages domestic alternatives.
Data centre energy. The cost of electricity has become a campaign issue. In PJM, the largest power grid in the US, capacity prices rose from around 29 to 329 dollars per megawatt-day between 2024/25 and 2026/27, largely because of data centre demand, and 71% of Americans oppose data centres being built in their communities, according to Gallup. Rules requiring tech companies to pay more for the energy they use could raise the cost of AI investment.
Regulation and competition. A Democratic Congress would likely step up scrutiny of Big Tech, with more hearings, investigations and pressure on competition and privacy, which could weigh on valuations even without new legislation.
Company earnings and guidance. Meta and Tesla opened the season on 21 October. Both beat estimates, but Meta fell almost 7% the next day after heavy AI spending pushed its free cash flow into negative territory, and Tesla also slipped after a sharp drop in operating income. Microsoft and Alphabet report on 28 October, Amazon on 29 October and Apple on 2 November. After the heavy selling in technology, the market will want evidence that investment in AI infrastructure, estimated at USD 720–745 billion this year for the four largest cloud providers, is translating into revenue and margins, and guidance for the coming quarters is likely to carry as much weight as the quarterly numbers. Strong results could restore technology's leadership; disappointing numbers could prolong the correction.
Beyond the vote, oil and the Fed could matter just as much for indices: Brent rose above USD 115 a barrel on 23 October, a five-month high, on fears of renewed US strikes on Iran, and while futures point to the Fed holding rates on 28 October, markets still expect a final hike in December.
What history tells us
The track record of the last ten midterm elections suggests that the period after the vote tends to be favourable. In every case, the S&P 500 was higher 12 months after election day, regardless of who won.
| Year | House | Senate | What changed | S&P 500 (12 months) |
|---|---|---|---|---|
| 1986 | D | D | Democrats regain the Senate | +1.1% |
| 1990 | D | D | Democrats keep Congress | +25.1% |
| 1994 | R | R | Republicans win both chambers | +27.1% |
| 1998 | R | R | Republicans keep Congress | +22.0% |
| 2002 | R | R | Republicans regain the Senate | +14.9% |
| 2006 | D | D | Democrats win both chambers | +6.7% |
| 2010 | R | D | Republicans win the House | +3.7% |
| 2014 | R | R | Republicans win the Senate | +4.5% |
| 2018 | D | R | Democrats win the House | +11.7% |
| 2022 | R | D | Republicans win the House | +14.5% |
| Average | +13.1% |
S&P 500 change from the election-day close to one year later, excluding dividends. Sources: S&P Dow Jones Indices (S&P 500 price index, daily closes); US House of Representatives and US Senate (election results). Capital.com calculations.
Past performance is not a reliable indicator of future results.
The average across these ten cycles was around 13%, and the weakest gain, 1.1% after 1986, included the October 1987 crash. The short term is more uneven: since 1950, according to data compiled by Opening Bell Daily, the S&P 500 has risen between election day and year-end in 13 of 19 cycles, with an average gain of 2.6%. In 2018, for example, the index fell 9% by the end of December under pressure from the Fed, yet was 11.7% higher a year after the vote. Each cycle had its own context, and there is no guarantee the pattern will repeat.
Always prioritise risk management during volatile market conditions, as increased fluctuations can amplify both potential gains and losses.