

What you need to know about Alphabet after the biggest one-day drop in its history – break-down
Google Cloud is growing fast, but AI spending pushed Alphabet’s free cash flow negative. A full break-down of results, valuation, debt and risks for GOOGL
On 29 October 2026, Alphabet's shares closed 12.6% lower at $283.82, wiping about $482bn off its market value. It was the biggest one-day loss in the company's history and the second-largest ever for a US-listed company, behind Nvidia's $593bn drop in January 2025.
Alphabet grew revenue 25% in Q3 2026, but net income fell 24% and free cash flow was negative at $9.1bn as AI investment more than doubled.
Key data
| Ticker / exchangeGOOGL · Nasdaq | SectorCommunication Services | Market cap$3.47trn |
|---|---|---|
| Previous close (04/11)$288.93 | Close (05/11)$282.57 (−2.2%) | 52-week range$270.70 – $408.61 |
| Dividend yield0.31% | Beta (5Y)1.23 | Next resultsFeb 2027 (TBC) |
Source: Yahoo Finance (GOOGL Class A quote and key data, close on 05/11/2026), Alphabet filings. Market cap includes all share classes.
Past performance is not a reliable indicator of future results.
Overview
Alphabet is Google's holding company and reports three segments. Google Services (Search, YouTube, Android, Chrome, Google Play, devices and subscriptions) generated $96.3bn in Q3 2026, about 75% of total revenue, mostly from advertising. Google Cloud (GCP infrastructure, Workspace and, since 2026, TPU system sales to third parties) brought in $30.7bn, up 103% year on year, and now accounts for 24% of revenue. Other Bets, including Waymo, remain small and loss-making. Looking ahead, the company is betting on its Gemini 4 models and the Gemini app, which it says has reached one billion users. It is also counting on TPU chip sales and a Cloud backlog of $561bn, according to CNBC. To fund this strategy, Alphabet plans capex of $195bn–$205bn in 2026 and a "significant" increase in 2027.
Profitability
Revenue growth accelerated from 12% to 25% year on year over eight quarters, led by Cloud, and EBITDA rose 33% in Q3 2026 to $48.9bn. Net income fell 24% to $26.5bn because of an $8.7bn loss on equity stakes, after one-off gains in Q1 and Q2 2026 ($99bn in Q2 alone, mostly SpaceX). The most important signal is in cash flow. Capex reached $51.4bn in a single quarter, and free cash flow came in at −$9.1bn. Operating margin held at 31.8%, close to its two-year average.
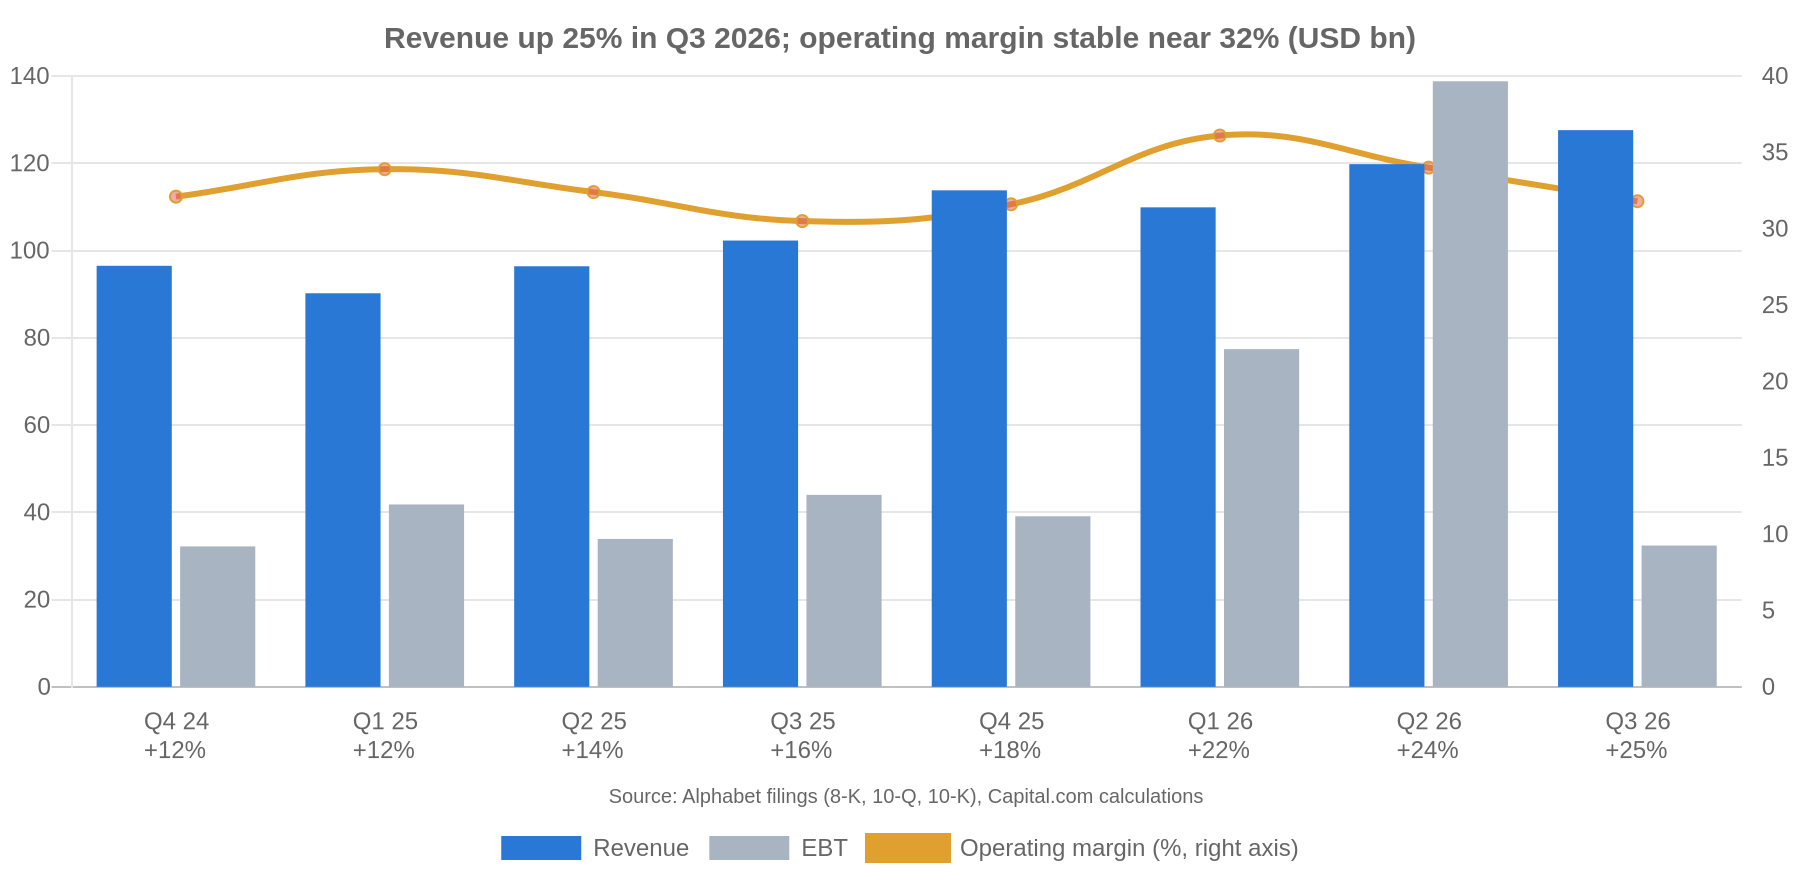
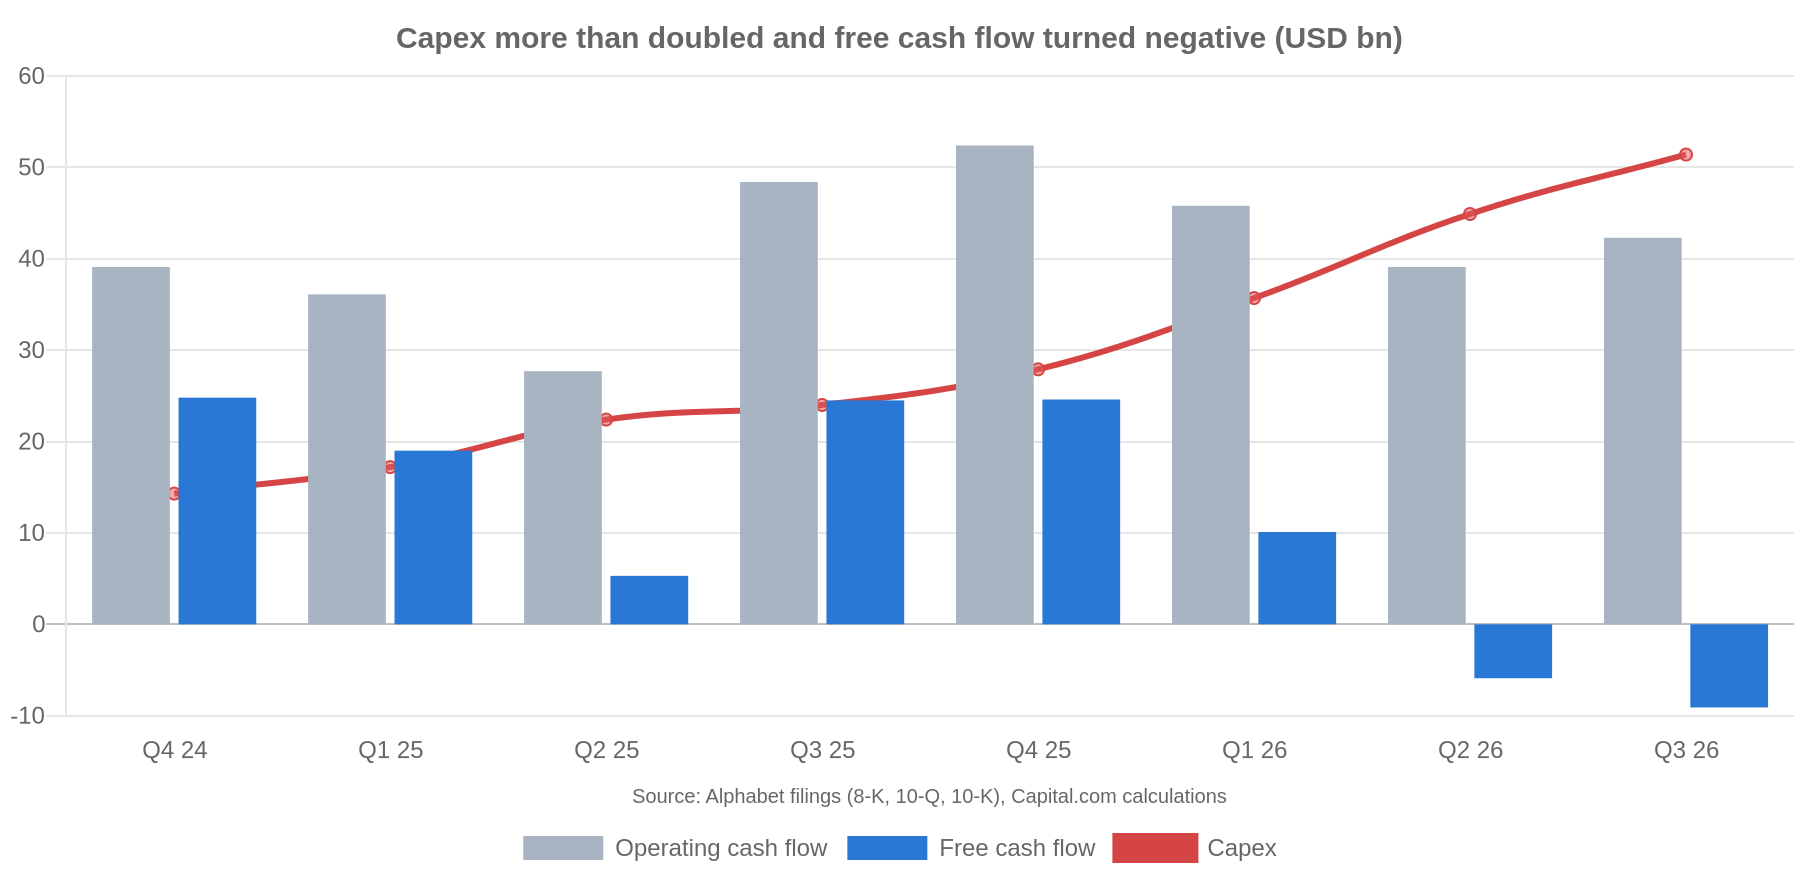
Source: Alphabet filings (8-K, 10-Q, 10-K), Capital.com calculations. EBITDA = operating income + depreciation of property and equipment; FCF = operating cash flow − capex. USD bn. Q1 and Q2 2026 EBT include unrealised gains on equity stakes (SpaceX and others); Q3 2025 includes the EC fine.
Past performance is not a reliable indicator of future results.
Quarterly trend: Q/Q and Y/Y changes
| USD bn | Q4 24 | Q1 25 | Q2 25 | Q3 25 | Q4 25 | Q1 26 | Q2 26 | Q3 26 |
|---|---|---|---|---|---|---|---|---|
| Revenue | 96.5 | 90.2 | 96.4 | 102.3 | 113.8 | 109.9 | 119.8 | 127.6 |
| % Q/Q | +9.3% | −6.5% | +6.9% | +6.1% | +11.2% | −3.5% | +9.0% | +6.5% |
| % Y/Y | +11.8% | +12.0% | +13.8% | +15.9% | +18.0% | +21.8% | +24.2% | +24.7% |
| EBITDA | 35.2 | 35.1 | 36.3 | 36.8 | 42.0 | 46.2 | 47.9 | 48.9 |
| % Q/Q | +8.2% | −0.2% | +3.4% | +1.6% | +13.9% | +10.0% | +3.7% | +2.2% |
| % Y/Y | +30.2% | +21.5% | +16.5% | +13.3% | +19.3% | +31.6% | +32.0% | +32.9% |
| EBT | 32.2 | 41.8 | 33.9 | 44.0 | 39.1 | 77.4 | 138.8 | 32.4 |
| % Q/Q | +1.7% | +29.6% | −18.8% | +29.6% | −11.1% | +97.9% | +79.2% | −76.7% |
| % Y/Y | +32.1% | +47.6% | +23.2% | +38.7% | +21.3% | +85.2% | +308.9% | −26.4% |
| Net income | 26.5 | 34.5 | 28.2 | 35.0 | 34.5 | 62.6 | 112.2 | 26.5 |
| % Q/Q | +0.9% | +30.2% | −18.4% | +24.1% | −1.5% | +81.6% | +79.3% | −76.4% |
| % Y/Y | +28.3% | +46.0% | +19.4% | +33.0% | +29.8% | +81.2% | +297.9% | −24.3% |
| Operating cash flow | 39.1 | 36.1 | 27.7 | 48.4 | 52.4 | 45.8 | 39.1 | 42.3 |
| % Q/Q | +27.4% | −7.6% | −23.2% | +74.5% | +8.2% | −12.6% | −14.7% | +8.2% |
| % Y/Y | +106.8% | +25.3% | +4.2% | +57.7% | +34.0% | +26.7% | +40.8% | −12.6% |
| Capex | 14.3 | 17.2 | 22.4 | 24.0 | 27.9 | 35.7 | 44.9 | 51.4 |
| % Q/Q | +9.3% | +20.5% | +30.5% | +6.7% | +16.3% | +28.1% | +25.9% | +14.3% |
| % Y/Y | +29.6% | +43.2% | +70.2% | +83.4% | +95.1% | +107.4% | +100.1% | +114.4% |
| Free cash flow | 24.8 | 19.0 | 5.3 | 24.5 | 24.6 | 10.1 | −5.9 | −9.1 |
| % Q/Q | +40.8% | −23.7% | −72.0% | +361.4% | +0.4% | −58.8% | n.s. | n.s. |
| % Y/Y | +214.6% | +12.6% | −60.6% | +38.7% | −1.2% | −46.6% | n.s. | n.s. |
| Gross margin | 57.9% | 59.7% | 59.5% | 59.6% | 59.8% | 62.4% | 61.6% | 59.7% |
| Operating margin | 32.1% | 33.9% | 32.4% | 30.5% | 31.6% | 36.1% | 34.0% | 31.8% |
Source: Alphabet filings (8-K, 10-Q, 10-K), Capital.com calculations. USD bn. Q/Q = change versus the previous quarter; Y/Y = change versus the same quarter a year earlier. n.s. = not meaningful (negative value). Q1–Q2 2026 EBT and net income include gains on equity stakes.
Past performance is not a reliable indicator of future results.
Results vs consensus and guidance
It was the first combined revenue and earnings miss in almost four years, according to CNBC, although Google Cloud came in well ahead of expectations.
| Revenue$127.6bnMiss · est. $128.2bn (−0.5%) | GAAP EPS$2.12Miss · est. $3.01 (−30%) | Google Cloud revenue$30.7bnBeat · est. ≈$28.7bn (+7%) |
|---|---|---|
| 2026 capex guidance$195bn–$205bnUnchanged | 2027 capexSignificant increaseDetails due with Q4 results | Cloud marginsNear-term pressureUse of third-party compute capacity |
Source: CNBC; Yahoo Finance (consensus estimates); Alphabet Q3 2026 earnings release.
Past performance is not a reliable indicator of future results.
Solvency
Alphabet still holds net cash (negative net debt) of $140bn, but long-term debt almost tripled in nine months, from $46.5bn to $125.1bn.
| Quarter end | LT debt | Cash + securities | Net debt | Equity | Net debt/TTM EBITDA | EBIT/interest | Current ratio |
|---|---|---|---|---|---|---|---|
| Sep 2026 | 125.1 | 265.1 | −140.0 | 677.5 | −0.76x | 42x | 2.79 |
| Jun 2026 | 98.2 | 242.5 | −144.3 | 640.5 | −0.83x | 32x | 2.72 |
| Mar 2026 | 77.5 | 126.8 | −49.3 | 478.7 | −0.31x | 74x | 1.92 |
| Dec 2025 | 46.5 | 126.8 | −80.3 | 415.3 | −0.53x | 121x | 2.01 |
| Sep 2025 | 21.6 | 98.5 | −76.9 | 386.9 | −0.54x | 218x | 1.75 |
| Jun 2025 | 23.6 | 95.1 | −71.5 | 362.9 | −0.51x | 120x | 1.90 |
| Mar 2025 | 10.9 | 95.3 | −84.4 | 345.3 | −0.63x | 900x | 1.77 |
| Dec 2024 | 10.9 | 95.7 | −84.8 | 325.1 | −0.66x | 584x | 1.84 |
Source: Alphabet balance sheets (10-Q and 8-K releases), Capital.com calculations. USD bn.
Past performance is not a reliable indicator of future results.
| Year end | LT debt | Cash + securities | Net debt | Equity | Net debt/EBITDA | Current ratio |
|---|---|---|---|---|---|---|
| 2025 | 46.5 | 126.8 | −80.3 | 415.3 | −0.53x | 2.01 |
| 2024 | 10.9 | 95.7 | −84.8 | 325.1 | −0.66x | 1.84 |
| 2023 | 13.3 | 110.9 | −97.7 | 283.4 | −1.02x | 2.10 |
| 2022 | 14.7 | 113.8 | −99.1 | 256.1 | −1.12x | 2.38 |
Source: Alphabet balance sheets (10-K, 10-Q and 8-K releases), Capital.com calculations. USD bn. LT debt = long-term debt, excluding the current portion (about $2bn) and leases. Cash + securities = cash and equivalents plus marketable securities. EBIT/interest = quarterly operating income divided by interest expense.
Past performance is not a reliable indicator of future results.
What happened. In 2026 the company tapped every funding source to pay for its AI build-out. It issued $80.5bn of bonds in six currencies: US dollars, euros, sterling, Swiss francs, Canadian dollars and yen. In June it raised $30.5bn in new equity, $10bn of it from a Berkshire Hathaway affiliate. On top of that came $19.1bn of 6.25% mandatory convertible preferred stock and $12.4bn sold through an at-the-market programme. In March it closed the $29.5bn acquisition of Wiz (cybersecurity), which lifted goodwill from $33.4bn to $58.1bn. Buybacks have been suspended: zero in 2026, versus $45.7bn in 2025.
Read the cash figure with care. The jump in securities in June includes the SpaceX stake, which is now listed. It comprises $80bn of shares with short-term sale restrictions and a further $14.1bn locked up until Q3 2027. Excluding it, net cash would be considerably lower and more volatile. In Q3 alone, the loss on equity stakes was $8.7bn.
Fines and litigation. In September 2025 the European Commission fined Google €2.95bn in the adtech case, a cost that explains the margin dip in Q3 2025. In the US, the final judgment in the DoJ Search case (December 2025) restricts distribution and requires data sharing with rivals. Google appealed in January 2026.
Maturities and rating. The debt is mostly long-dated and fixed-rate. Only $2bn falls due in 2026, and the remaining issues mature between 2027 and 2126. The 2026 issues carry weighted-average maturities of 8 to 31 years. The $25bn commercial paper programme is unused. Moody's rates Alphabet's senior unsecured debt Aa2 with a stable outlook, and S&P assigned an AA+ issue-level rating to the 2026 yen notes, according to Investing.com.
Shareholder returns
In 2026 Alphabet stopped returning capital through buybacks and started issuing shares, so its share count rose instead of falling.
| USD bn | 2023 | 2024 | 2025 | 9M 2026 |
|---|---|---|---|---|
| Share buybacks | 61.5 | 62.2 | 45.7 | 0.0 |
| Dividends paid | 0.0 | 7.4 | 10.0 | 8.2 |
| Share issuance (common + preferred) | 0.0 | 0.0 | 0.0 | 61.9 |
| Stock-based compensation | 22.5 | 22.8 | 25.0 | 23.3 |
Source: Alphabet cash flow statements (10-K, 10-Q, 8-K), Capital.com calculations. 2026 dividends include preferred dividends.
Past performance is not a reliable indicator of future results.
The quarterly dividend is $0.22 per share, a 0.31% yield and a payout of about 8% of 2025 earnings. Shares outstanding rose from 12,088m (December 2025) to 12,294m (September 2026), 1.7% dilution in nine months. The convertible preferred stock and the $27.6bn still available under the at-the-market programme add to this. Stock-based compensation over the last 12 months reached $30.4bn, about 6.5% of revenue.
Relative valuation and competition
Alphabet's trailing P/E of 15x is inflated by gains on equity stakes. Excluding those gains, the multiple rises to about 27x, while the 19x forward P/E is the second-lowest in the group, after Meta.
| Company | TTM P/E | Forward P/E | Est. revenue growth, next year |
|---|---|---|---|
| Alphabet (GOOGL) | 14.8x (≈27x ex equity gains) | 18.9x (2027) | +27.0% (2027) |
| Meta (META) | 20.6x | 17.8x (2027) | +21.6% (2027) |
| Amazon (AMZN) | 21.0x | 24.4x (2027) | +15.6% (2027) |
| Microsoft (MSFT) | 28.0x | 26.8x (FY to Jun 2027) | +19.3% (FY2027) |
| Apple (AAPL) | 38.3x | 36.4x (FY to Sep 2027) | +14.8% (FY2027) |
Source: Yahoo Finance (closing prices on 05/11/2026, average consensus estimates as of 06/11/2026), Capital.com calculations. The ex-gains P/E taxes TTM operating income ($157.0bn) at 17%.
Past performance is not a reliable indicator of future results.
Other Alphabet multiples: TTM EV/EBITDA is about 18.0x and price-to-sales is 7.4x. P/FCF (≈175x) and PEG are not meaningful at the moment. The first reflects FCF depressed by capex. The second reflects the expected drop in 2027 EPS versus an inflated 2026.
Competition.
- Search: Google competes with AI assistants such as ChatGPT. The company says search query growth is the highest in five years.
- Cloud: Google Cloud is still behind AWS (Amazon) and Azure (Microsoft), but growing faster.
- Chips: TPUs put Alphabet in direct competition with Nvidia.
- YouTube: competes for users' attention with TikTok, Instagram and Netflix.
Analyst consensus. The average price target is $400.37, in a range of $300 to $500, according to data compiled by Yahoo Finance (06/11/2026). Since the results, the 2026 EPS estimate has fallen from $20.60 to $19.71 and the 2027 estimate from $15.15 to $14.95. On 29/10, Bernstein cut its target from $385 to $325, according to Finanztrends.
Catalysts and risks
The next big test is Q4 2026 results in February, when the company is due to put a number on 2027 capex.
Catalysts
- The size of 2027 capex, and any signal that the investment cycle is peaking.
- Conversion of the $561bn Cloud backlog into revenue, and the segment's margin trend.
- TPU system sales to third parties and adoption of Gemini 4 models.
- The end of sale restrictions on the SpaceX shares, which could be monetised.
Risks
- Prolonged negative free cash flow and further debt or equity issuance (dilution).
- Cloud margins squeezed by the use of third-party compute capacity.
- Regulation: the appeal in the DoJ Search case, adtech cases in the US and EU, and fines elsewhere (South Korea fined Google over in-app payment systems).
- Competition from generative AI in search, and pressure on advertising.
- Earnings volatility from equity stakes (SpaceX, Anthropic and others).
- Currency: about 47% of revenue comes from outside the US.
Technical analysis
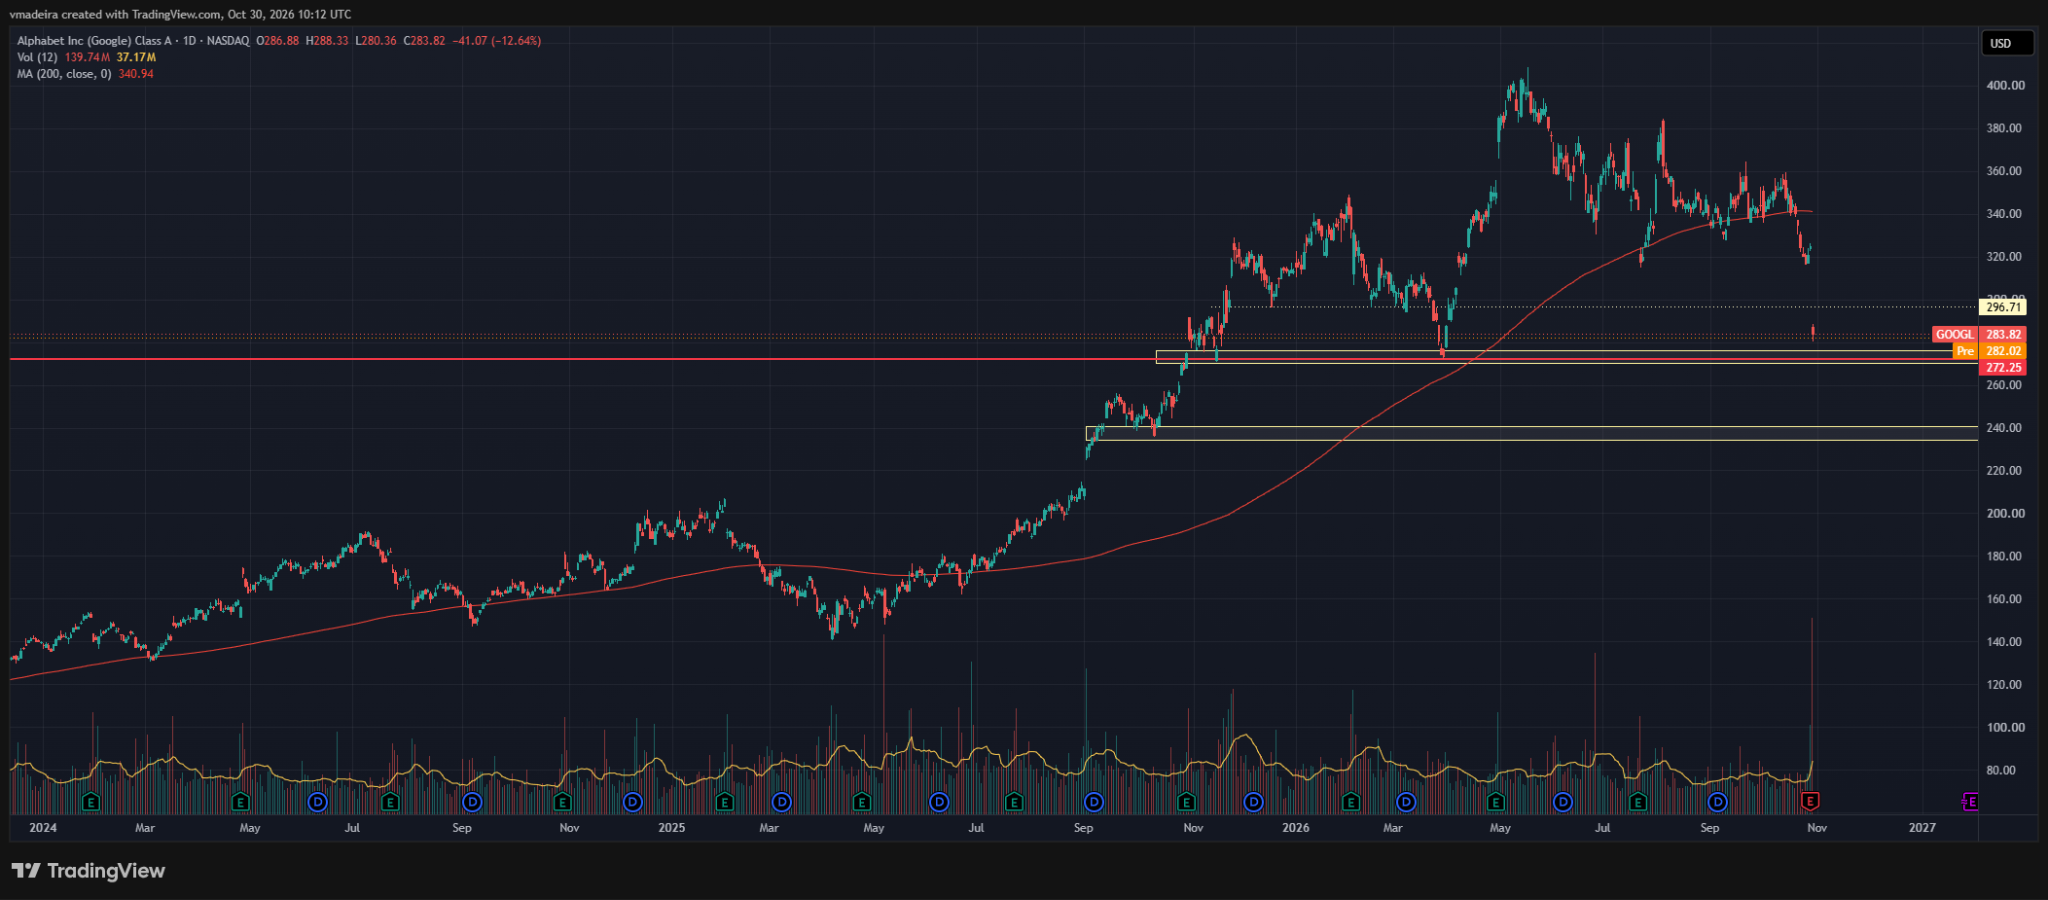
Source: TradingView (Capital.com), daily chart, GOOGL
Past performance is not a reliable indicator of future results.
The shares had been showing weakness since May 2026, when they hit the all-time high of $408.61 and began to correct. After the July results, they fell sharply again and tested the 200-day SMA (red line). In October, they failed to hold above the $340 area and dropped back below the 200-day SMA.
On 29 October, after the results, the shares closed 12.6% lower at $283.82, close to October 2025 levels. Since then, they have moved between the 30 October intraday low of $276.92 and the 4 November high of $296.49, and closed at $282.57 on 5 November. Below, the technical support area is around $271, the 52-week low of $270.70. Above, the resistance area is around $296–297, formed by the highs of 4 and 5 November.
Summary
Alphabet's operating business is accelerating, but the market is now weighing what that growth costs in cash and dilution.
Strengths
- Revenue growing 25%, with Cloud doubling (+103%) and a $561bn backlog.
- Stable operating margin above 30% and EBITDA up 33%.
- $140bn of net cash and long-dated long-term debt.
Factors to watch
- Negative free cash flow for two quarters in a row, and even higher capex in 2027.
- End of buybacks, share issuance, and debt almost tripling in 2026.
- Accounting earnings distorted by equity stakes: the 15x P/E hides a multiple of about 27x on operating earnings.
- Regulatory risk in Search and adtech.