

NVIDIA stock forecast: Hugging Face acquisition
Nvidia is a US semiconductor company. In September 2026, it agreed to acquire AI platform Hugging Face for approximately $12.93bn. Explore third-party NVDA price targets and technical analysis. Past performance is not a reliable indicator of future results.
NVIDIA Corporation (NVDA) traded at $223.32 as of 8:35am UTC on 10 September 2026, within an intraday range of $222.78–$226.23. Past performance is not a reliable indicator of future results.
The move follows a softer session for US equities, with the S&P 500 closing lower on 8 September amid AI-related valuation concerns, while Middle East tensions lifted oil prices (Reuters, 8 September 2026). Nvidia also reported that director Mark A. Stevens sold 1,022,239 shares through associated trusts on 3–4 September at $227.25–$234.04 (StockTitan, 8 September 2026). Attention now turns to chief executive Jensen Huang's scheduled appearance at Goldman Sachs' Communacopia and Technology Conference later on 10 September, following Nvidia's $12.93bn agreement to acquire AI platform Hugging Face (Barchart, 8 September 2026).
Third-party Nvidia outlook: Hugging Face deal, AI competition
As of 10 September 2026, third-party NVIDIA stock predictions reflect different assumptions around AI chip demand, data-centre spending, revenue growth and margins following its fiscal second-quarter results.
Morgan Stanley
Morgan Stanley maintains an overweight rating and $300 target. The bank's revised outlook reflects expectations for higher fiscal 2028 data-centre revenue (GuruFocus, 27 August 2026).
BMO Capital Markets
BMO Capital Markets maintains a $340 target and outperform rating, reflecting expectations for continued AI accelerator demand into Nvidia's next fiscal year (Investing.com, 8 September 2026).
Cantor Fitzgerald
Cantor Fitzgerald reiterates a $350 target and buy rating. The firm cites continued hyperscaler capital spending as a potential support for chip demand into 2027 (Yahoo Finance, 9 September 2026).
Needham and Company
Needham and Company raises its target to $300 from $270 while reiterating a buy rating. The revision reflects its view of Nvidia's revenue trajectory amid continued AI accelerator demand (Yahoo Finance, 27 August 2026).
Rosenblatt Securities
Rosenblatt Securities reiterates a $390 target and buy rating. Its outlook reflects assumptions around software and platform revenue following Nvidia's Hugging Face agreement (Investing.com, 27 August 2026).
Predictions and third-party forecasts are inherently uncertain, as they cannot fully account for unexpected market developments. Past performance is not a reliable indicator of future results.
Nvidia earnings: latest results and upcoming report
Nvidia reported second-quarter fiscal 2027 results on 26 August for the period ended 26 July. Revenue reached $96.2bn, up 18% quarter on quarter and 106% year on year, while data-centre revenue rose 117% year on year to $89bn. GAAP and non-GAAP gross margins were both 75%, while GAAP diluted earnings per share reached $2.46 and non-GAAP diluted earnings per share was $2.22 (NVIDIA, 26 August 2026).
For the third quarter, Nvidia guided revenue to $108bn, plus or minus 2%, with non-GAAP operating expenses of approximately $9bn and gross margin of 71%–72% amid higher memory component costs. The company also returned $26bn to shareholders during Q2, including $20bn in share repurchases and $6bn in dividends, with approximately $99bn remaining under its repurchase authorisation at quarter-end.
Nvidia's next earnings release, covering the third quarter of fiscal 2027, is expected around 18 November 2026 based on previous reporting patterns (MarketBeat, 26 August 2026).
Past or simulated performance is not a reliable indicator of future results. Company guidance reflects management's assumptions and may not materialise as expected.
NVDA stock price: technical overview
As of 8:35am UTC on 10 September 2026, the NVDA stock price trades near its 20-day simple moving average, with the 20-, 50-, 100- and 200-day SMAs at roughly $221, $212, $211 and $197 respectively, according to TradingView. The latest price sits above all four averages, while the Hull moving average (9) is slightly higher at around $226.
The 14-day relative strength index (RSI) stands near 54, within neutral territory. The average directional index (ADX) reads around 17, indicating relatively limited trend strength without signalling future direction.
Higher technical references include the classic R1 pivot near $235 and R2 around $250. Below the latest price, the classic pivot near $216 provides a nearer reference, followed by the 200-day simple moving average around $197.
A move higher could bring $235 and $250 into focus, while a decline could shift attention towards $216 and $197 (TradingView, 10 September 2026).
This is technical analysis for informational purposes only and does not constitute investment advice or a recommendation to buy or sell any instrument.
NVIDIA share price history (2024–2026)
NVDA’s stock price closed at $119.20 on 12 September 2024 before falling to $93.42 on 8 April 2025 during a broader market sell-off linked to newly announced US tariffs. The shares subsequently recovered above $150.
The rise continued into 2026, with NVDA reaching $237.95 intraday on 14 May during a period of higher data-centre demand. Shares later fell to $206.97 on 3 August before recovering through late August and early September, alongside the company's fiscal second-quarter results and agreement to acquire Hugging Face.
As of 8:35am UTC on 10 September 2026, NVDA traded at $223.32, around 18.3% above its 2 January 2026 close and approximately 26% higher year on year. The period included substantial moves in both directions.

Past performance is not a reliable indicator of future results. Share prices are indicative and may differ from live market prices.
NVIDIA (NVDA): Capital.com analyst view
Nvidia shares have risen overall in 2026 while moving substantially in both directions, from a $188.74 close on 2 January to around $223 by 10 September. The period has coincided with higher AI-related computing demand, revenue growth and continued data-centre investment. At the same time, valuation concerns and higher memory costs remain potential pressures on sentiment and margins.
Continued AI infrastructure spending, data-centre demand or revenue growth could support the shares if these trends develop as expected. Conversely, weaker customer spending, margin pressure, greater competition or regulatory developments in the semiconductor sector could weigh on them. How these factors develop may influence how market participants assess Nvidia's valuation.
Capital.com’s client sentiment for NVIDIA CFDs
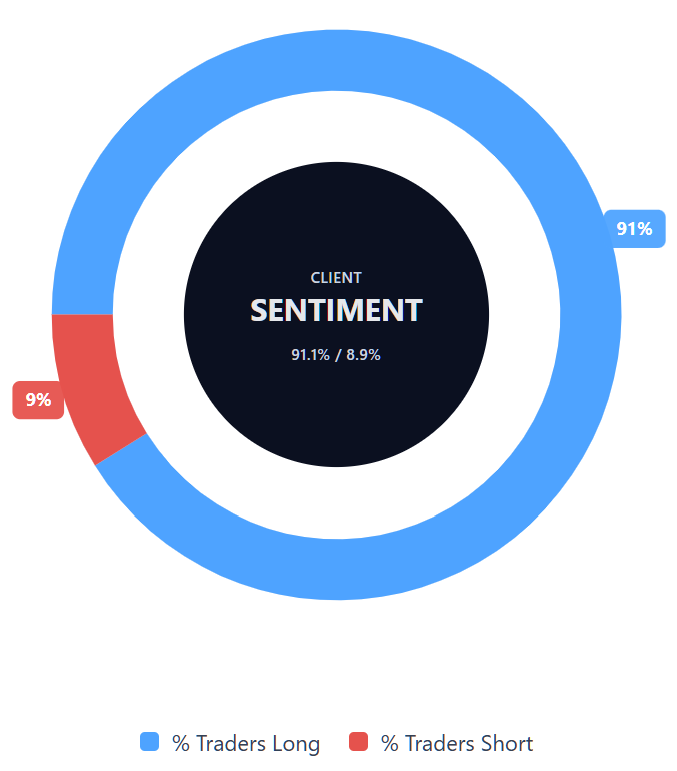
As of 10 September 2026, Capital.com client positioning in NVIDIA CFDs is weighted towards long positions, with 91.1% long and 8.9% short. This reflects open positions on Capital.com at the time of measurement rather than future price direction and can change.
Summary – NVIDIA 2026
- As of 8:35am UTC on 10 September 2026, Nvidia traded near $223.32, within an intraday range of $222.78–$226.23.
- According to TradingView data, the price was above its 20-, 50-, 100- and 200-day moving averages, while RSI stood near 54 and ADX near 17, indicating limited trend strength.
- Key factors include AI chip demand, data-centre spending, higher memory costs and broader market conditions.
- Higher AI spending, revenue growth or data-centre demand could support sentiment, while margin pressure, weaker spending or greater competition could weigh on the shares.
- Recent attention centres on Nvidia's $12.93bn agreement to acquire Hugging Face, its fiscal Q2 2027 results and Jensen Huang's Goldman Sachs conference appearance.
Past performance is not a reliable indicator of future results.
FAQ
Who owns the most NVIDIA stock?
This article does not identify NVIDIA's largest shareholder or provide a detailed ownership breakdown. It focuses instead on share-price performance, earnings, AI-related demand, data-centre spending, valuation and third-party analyst forecasts. Ownership can change as institutional and other investors adjust their holdings, so current shareholder filings would need to be checked separately to determine which investor presently holds the largest stake in NVIDIA.
What is the five-year NVIDIA share price forecast?
The article does not provide a five-year NVDA stock forecast. The third-party estimates covered here focus on nearer-term targets, with the cited broker range at $300–$390. Longer-term forecasts involve greater uncertainty because AI demand, customer spending, competition, margins, regulation and execution can change materially over several years. These estimates should therefore be treated as scenarios rather than reliable predictions of where NVIDIA shares may trade in five years.
Is NVIDIA a good stock to buy?
This article does not classify NVIDIA as a good or bad stock to buy. Continued AI infrastructure spending, data-centre demand and revenue growth could support sentiment, while weaker customer spending, margin pressure, competition or regulatory developments could weigh on the shares. Analyst targets are also based on assumptions that may not materialise. These factors provide context for assessing NVIDIA's outlook but do not amount to an investment recommendation.
Could NVIDIA stock go up or down?
Yes. NVIDIA shares can move in either direction as company-specific and wider market conditions change. Stronger AI spending, higher data-centre demand or further revenue growth could support the price. Conversely, weaker customer spending, rising memory costs, margin pressure, greater competition or regulatory developments could weigh on it. Technical levels may also influence short-term trading activity, but they are reference points rather than reliable predictions of future price movements.
Should I invest in NVIDIA stock?
Whether NVIDIA shares are suitable for you depends on your circumstances, objectives and tolerance for risk, and this article does not provide investment advice or a personal recommendation. Factors to consider include AI demand, data-centre spending, revenue growth, valuation, margins, competition and regulatory risk. Each could influence the share price positively or negatively, while unexpected company or market developments may change the outlook. Third-party analyst targets should also be treated as estimates rather than guarantees.
Can I trade NVIDIA CFDs on Capital.com?
Yes, you can trade NVIDIA CFDs on Capital.com. Trading share CFDs lets you speculate on price movements without owning the underlying asset and to take long or short positions. However, contracts for difference (CFDs) are traded on margin, and leverage amplifies both profits and losses. You should ensure you understand how CFD trading works, assess your risk tolerance, and recognise that losses can occur quickly.