

Michael Kramer: How to Analyse SanDisk Before Earnings
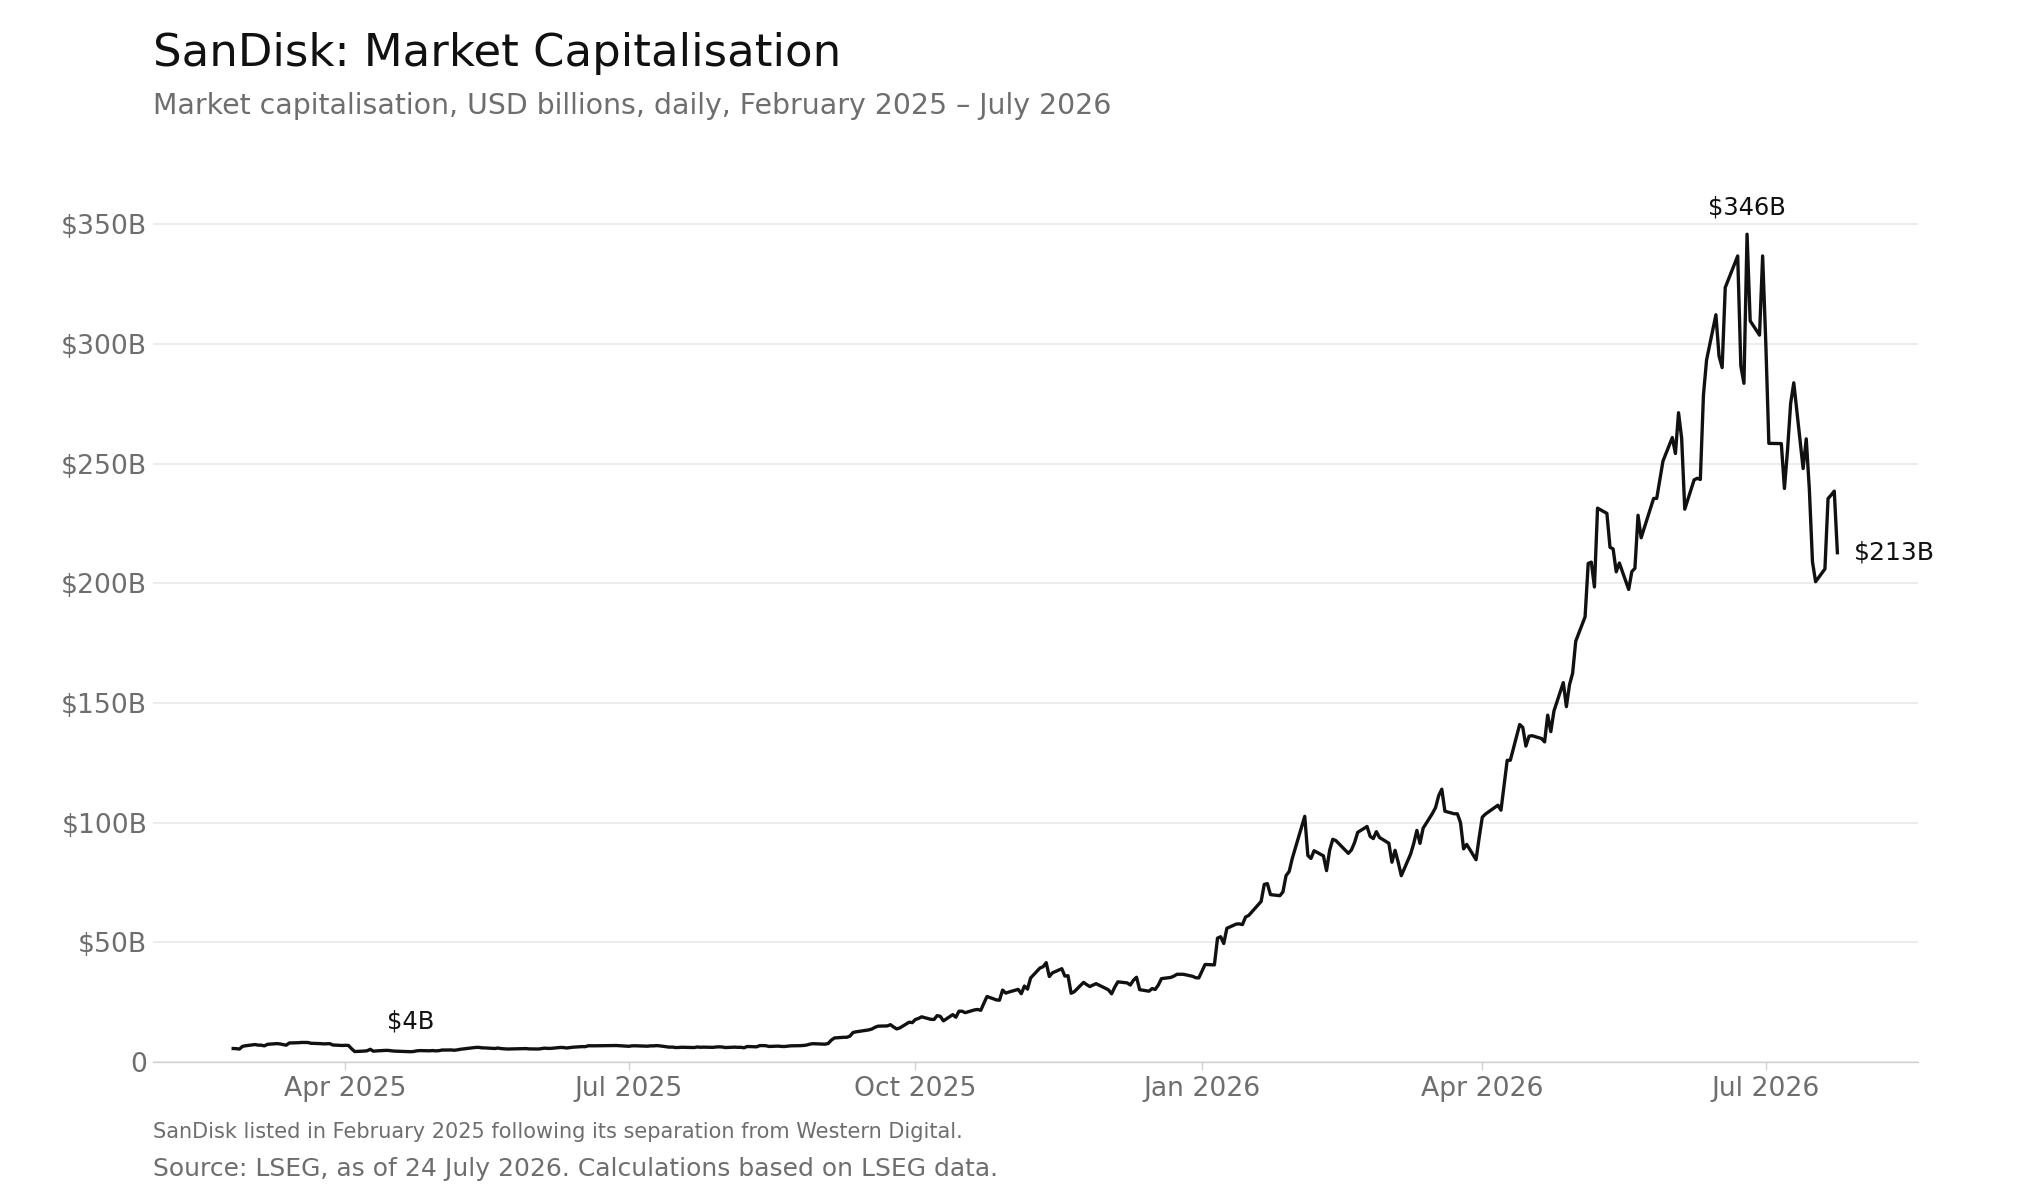
SanDisk’s market capitalisation rose from roughly $5.6 billion at its February 2025 listing, after touching a low of about $4 billion in April 2025, to a 2026 high of approximately $346 billion, before settling at $213 billion on 24 July 2026.
SanDisk’s market capitalisation rose from roughly $5.6 billion at its February 2025 listing, after touching a low of about $4 billion in April 2025, to a 2026 high of approximately $346 billion, before settling at $213 billion on 24 July 2026. Its separation from Western Digital was completed on 21 February 2025, and its shares began trading independently on Nasdaq on 24 February 2025.
(Source: LSEG, as of 24 July 2026. Calculations based on LSEG data)
(Past performance is not a reliable indicator of future results)
Earnings History
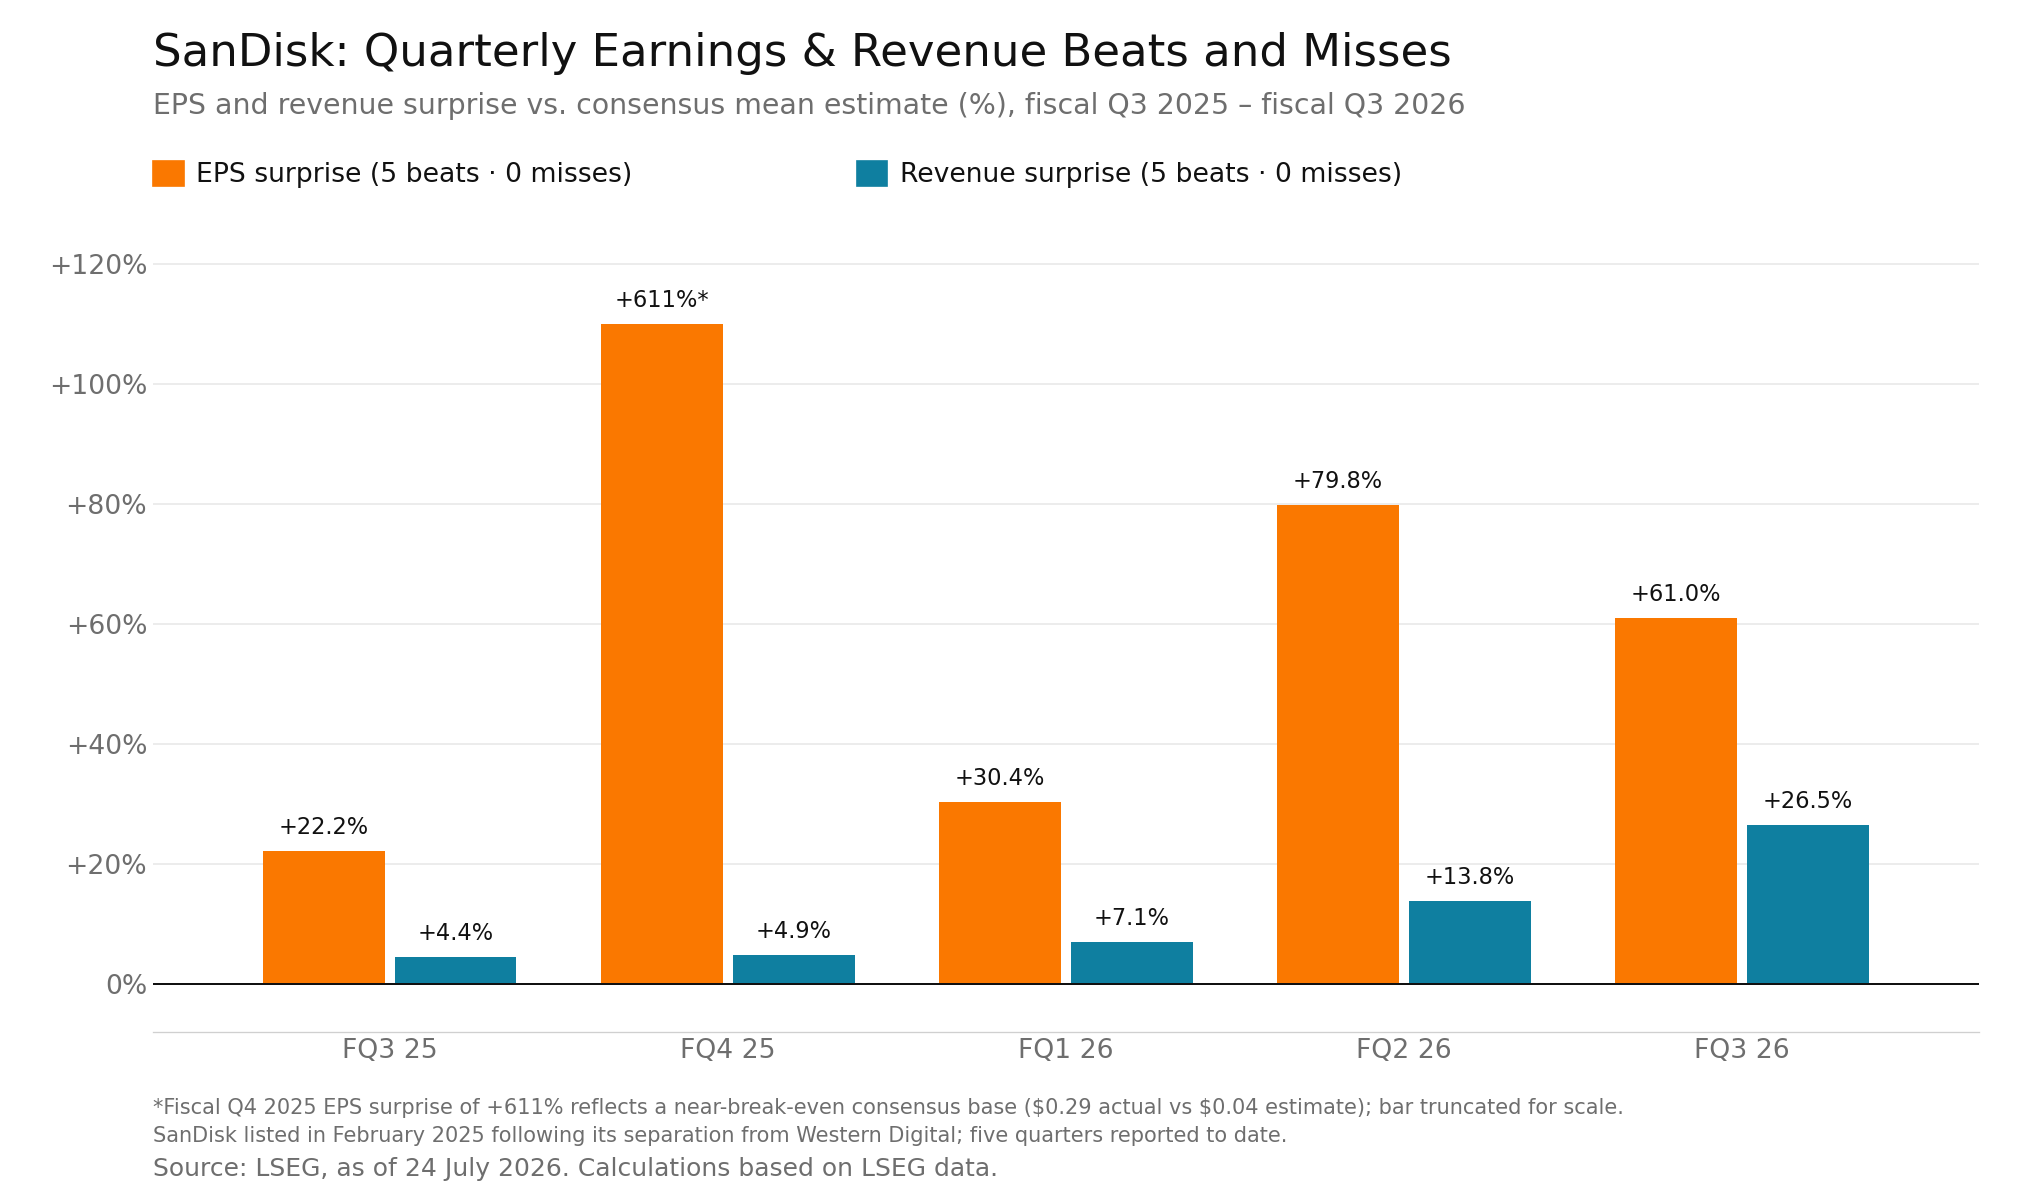
Over the five quarters shown, SanDisk’s revenue and adjusted EPS each exceeded analysts’ consensus mean estimates in every quarter. Adjusted EPS exceeded consensus by more than 20% in each quarter, while the revenue surprise rose from 4.4% in fiscal Q3 2025 to 26.5% in fiscal Q3 2026.
(Source: LSEG, as of 24 July 2026. Calculations based on LSEG data)
(Past performance is not a reliable indicator of future results)
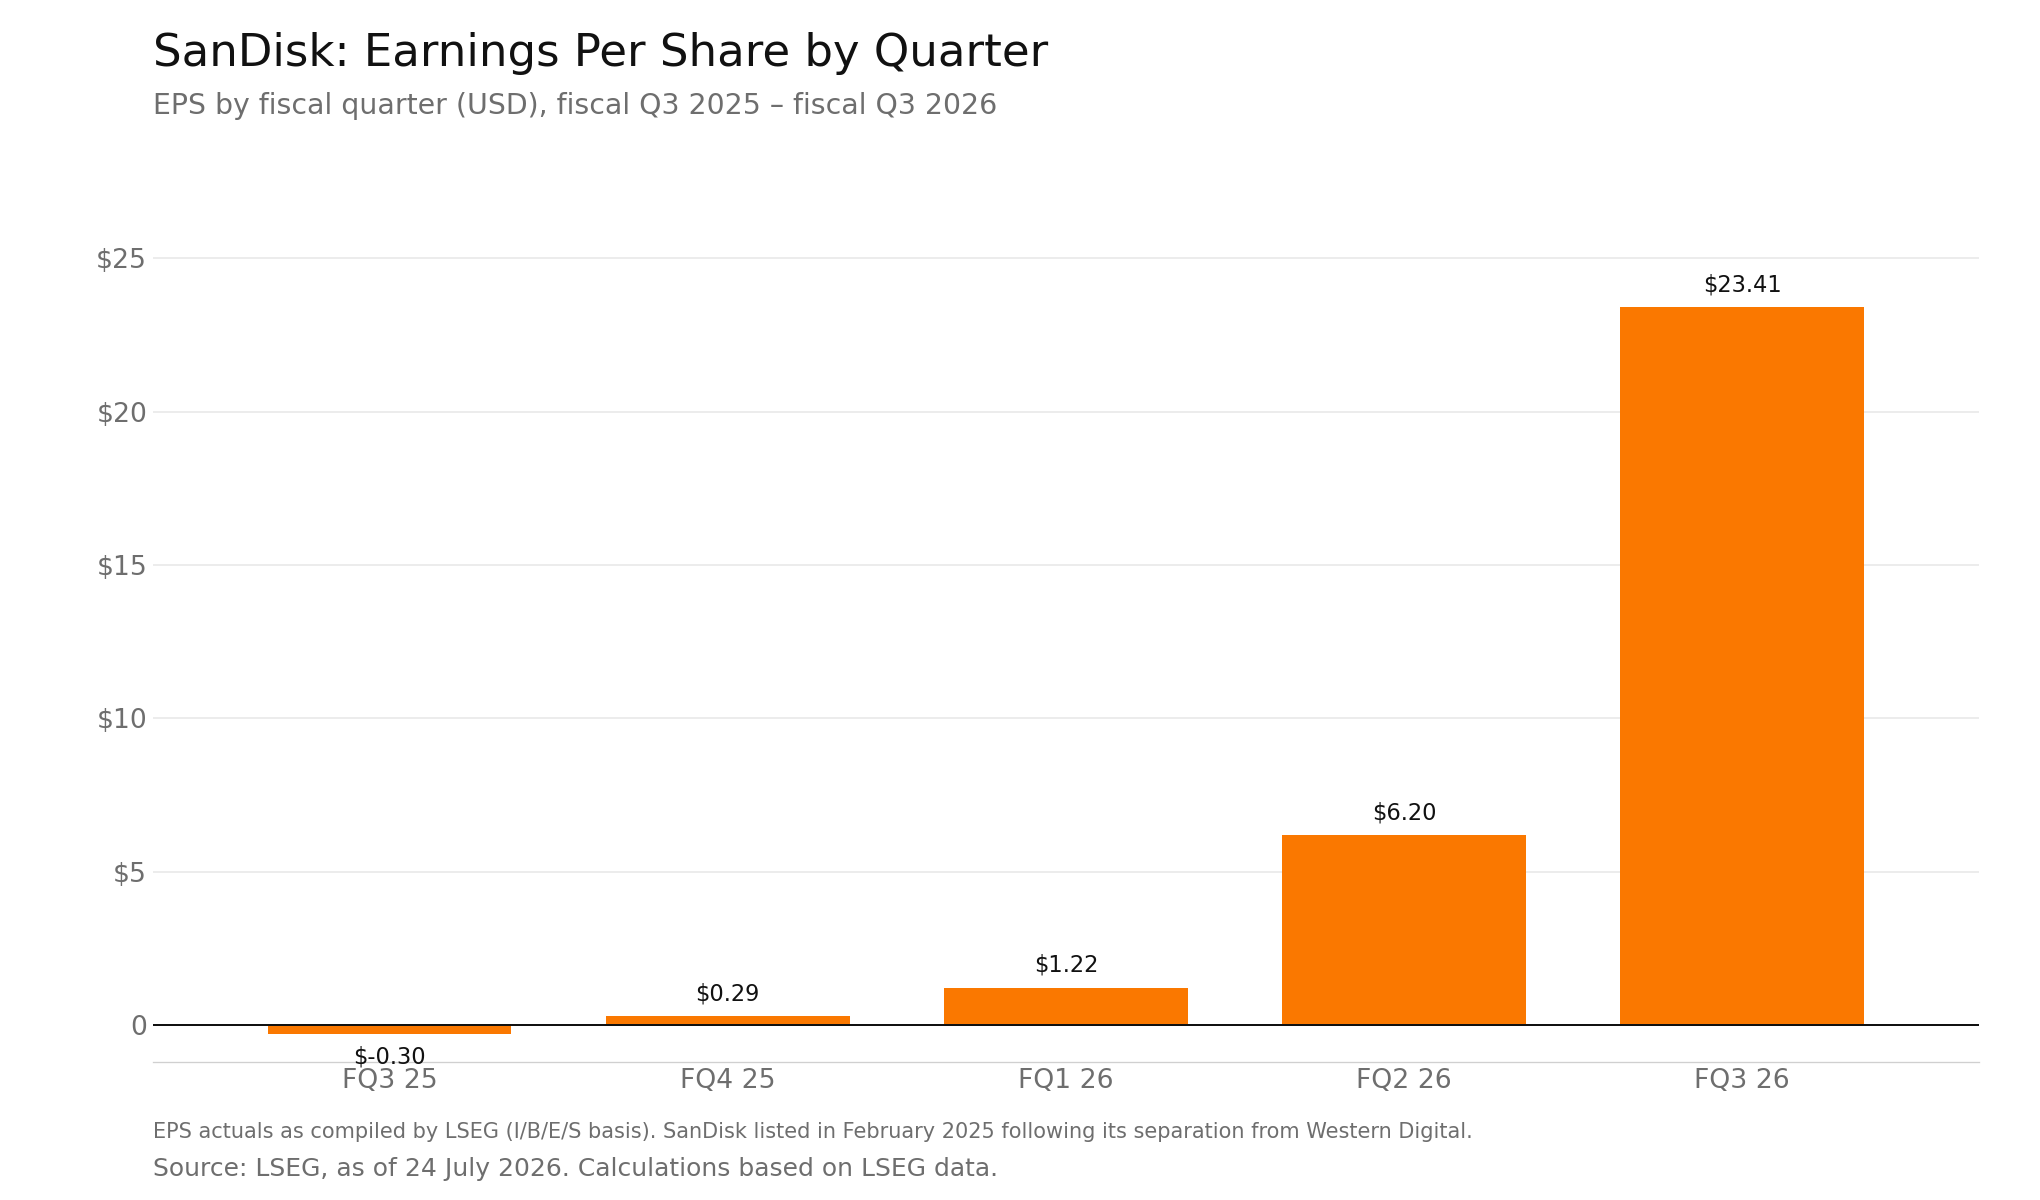
Adjusted EPS improved across the five quarters shown, from a loss of $0.30 per share in fiscal Q3 2025 to positive EPS of $0.29 in fiscal Q4 2025 and $23.41 in fiscal Q3 2026.
(Source: LSEG, as of 24 July 2026. Calculations based on LSEG data)
(Past performance is not a reliable indicator of future results)
Revenue Growth
In fiscal Q3 2026, revenue more than tripled to $5.95 billion from $1.70 billion a year earlier. The result exceeded analysts’ consensus mean estimate of approximately $4.70 billion by about $1.25 billion, or 26.5%.
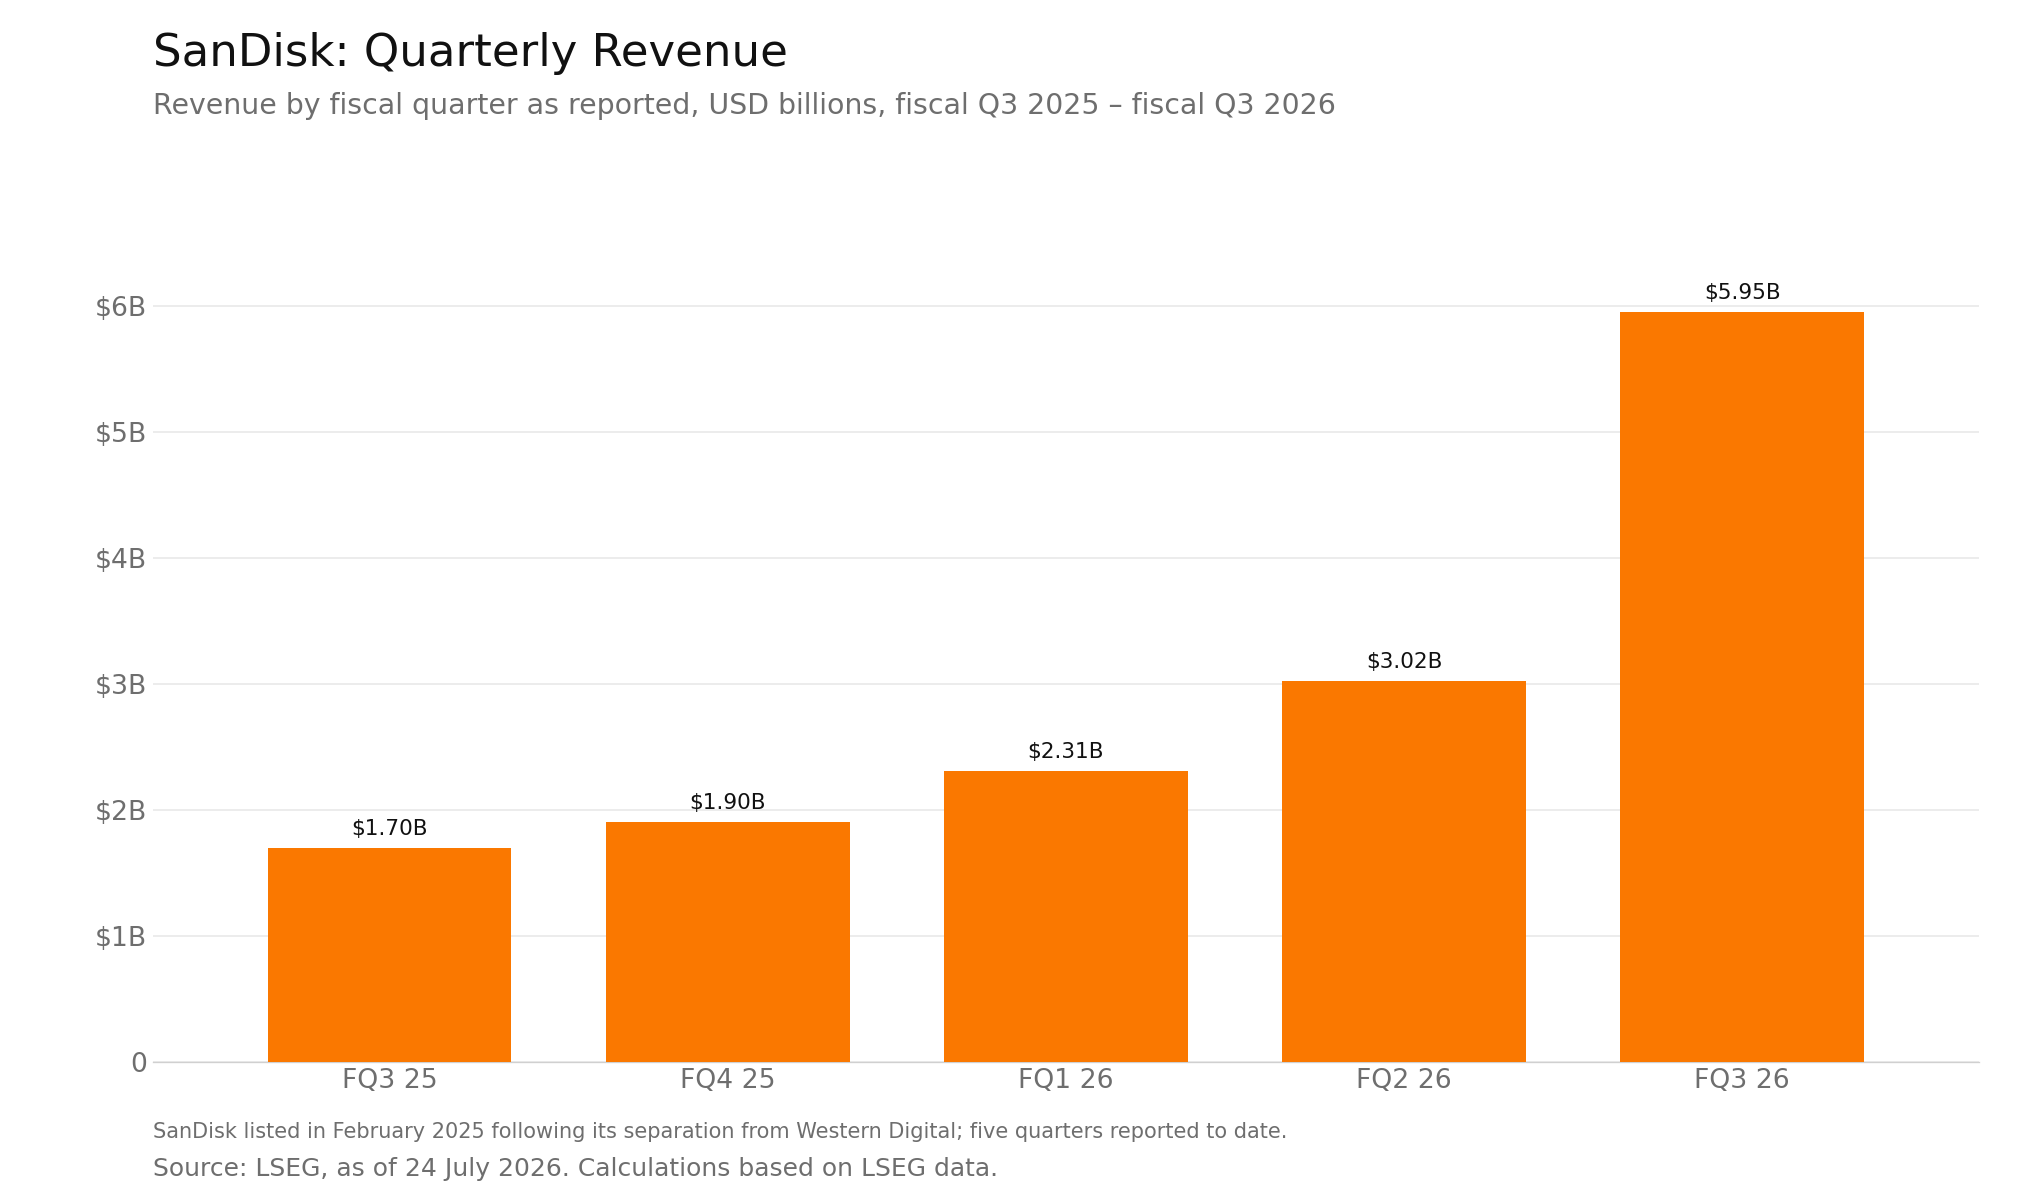
(Source: LSEG, as of 24 July 2026. Calculations based on LSEG data)
(Past performance is not a reliable indicator of future results)
Gross Margins
Gross margin increased in each of the five quarters shown, rising from 22.5% in fiscal Q3 2025 to 78.4% in fiscal Q3 2026.
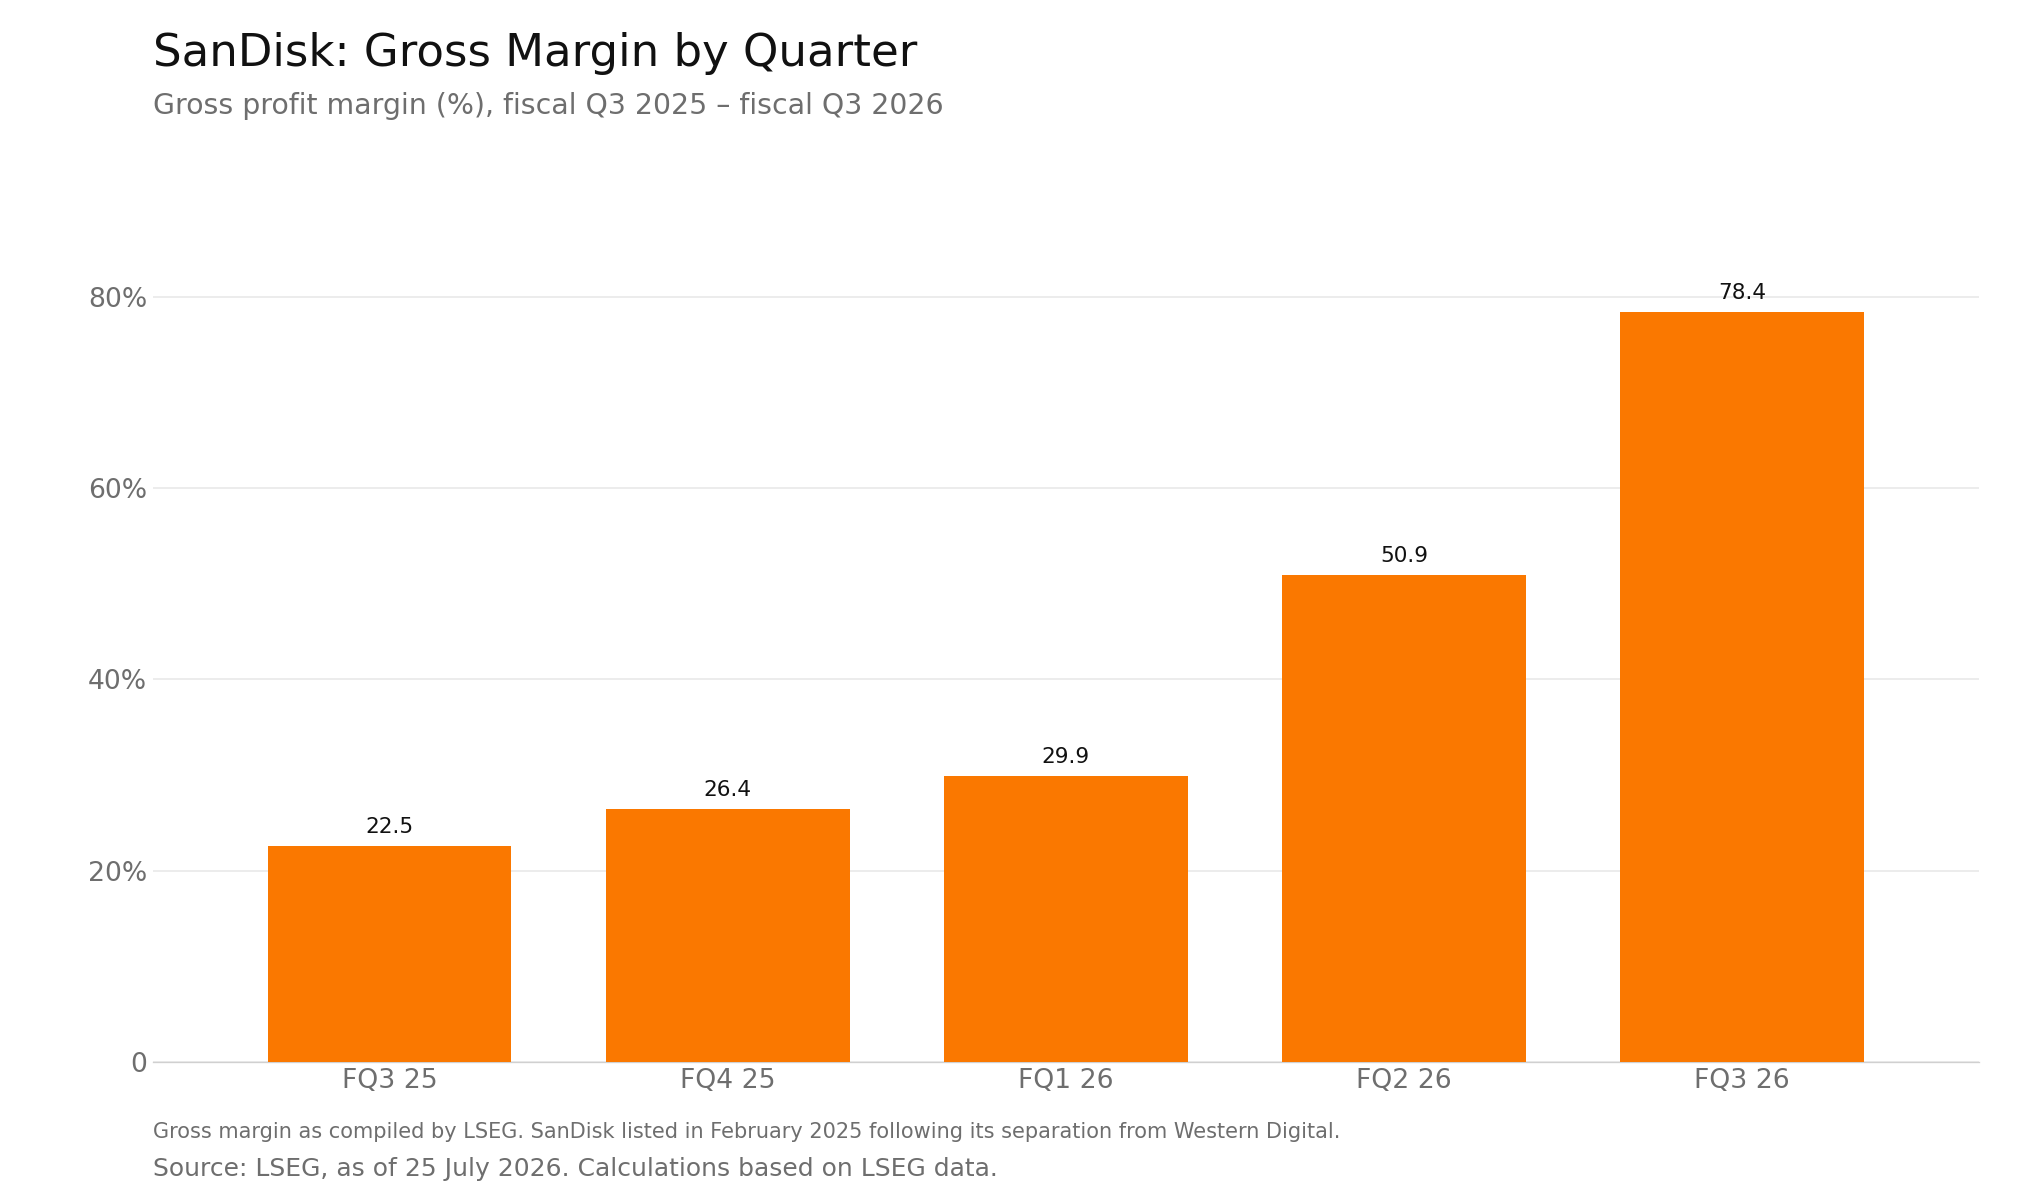
(Source: LSEG, as of 24 July 2026. Calculations based on LSEG data)
(Past performance is not a reliable indicator of future results)
Free Cash Flow
SanDisk’s free cash flow increased in each of the five quarters shown, from negative $18 million in fiscal Q3 2025 to $2.99 billion in fiscal Q3 2026.
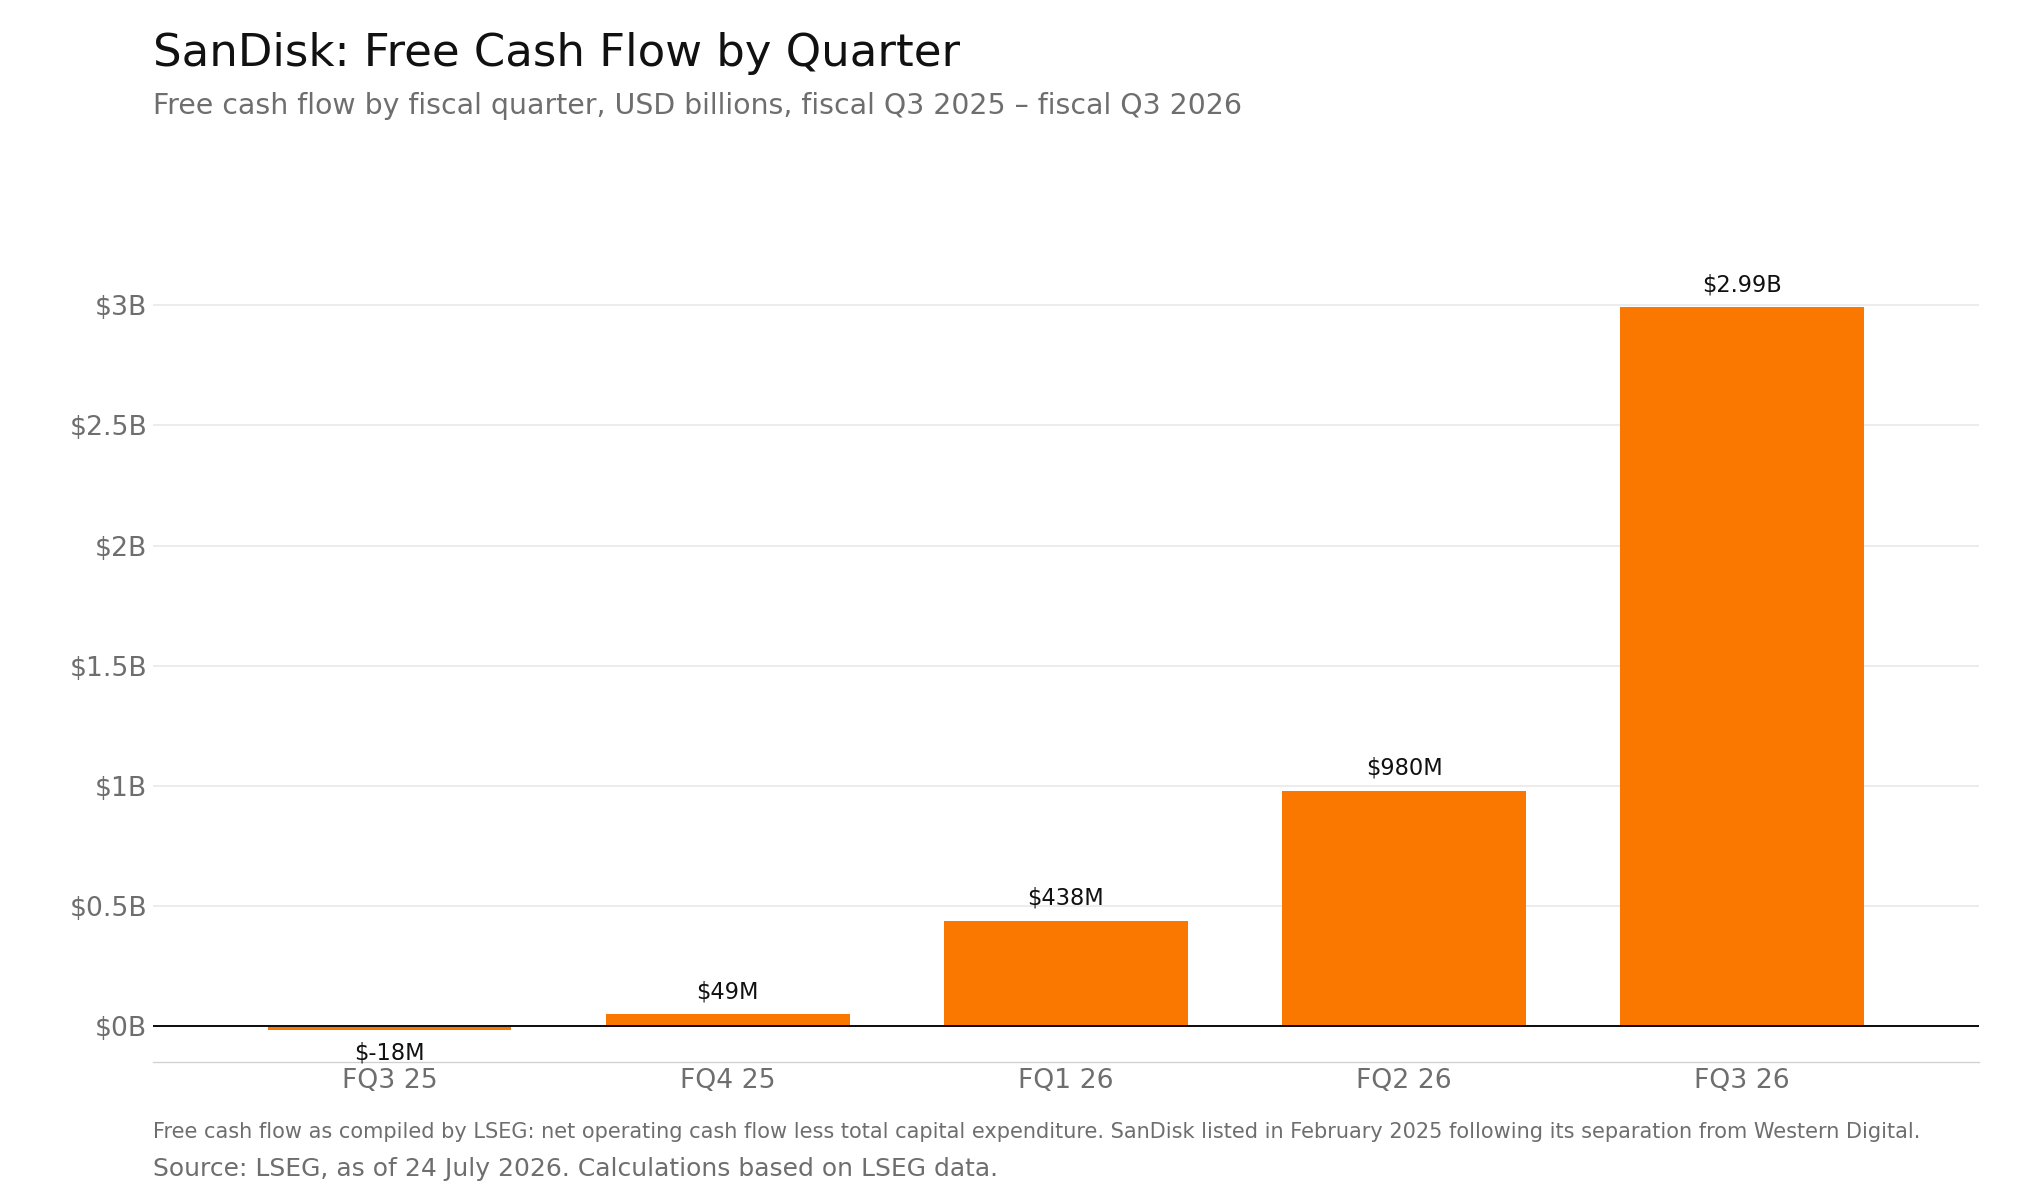
(Source: LSEG, as of 24 July 2026. Calculations based on LSEG data)
(Past performance is not a reliable indicator of future results)
Options-Implied Earnings Range
Option prices can be used to calculate an implied trading range around an earnings announcement. Across the five announcements shown, 10-day at-the-money implied volatility produced an average one-standard-deviation range of ±21.7%, while the average absolute realised next-session move was 8.0%. The next-session share-price move remained within the calculated range in all five cases.
The implied range was estimated using the 10-day at-the-money implied volatility observed at the last close before each report, scaled to the option’s 10-day term using implied volatility × √(10/365) and applied to the share price. This produces a one-standard-deviation range derived from option prices. It does not represent a forecast or indicate the direction of the share-price move.
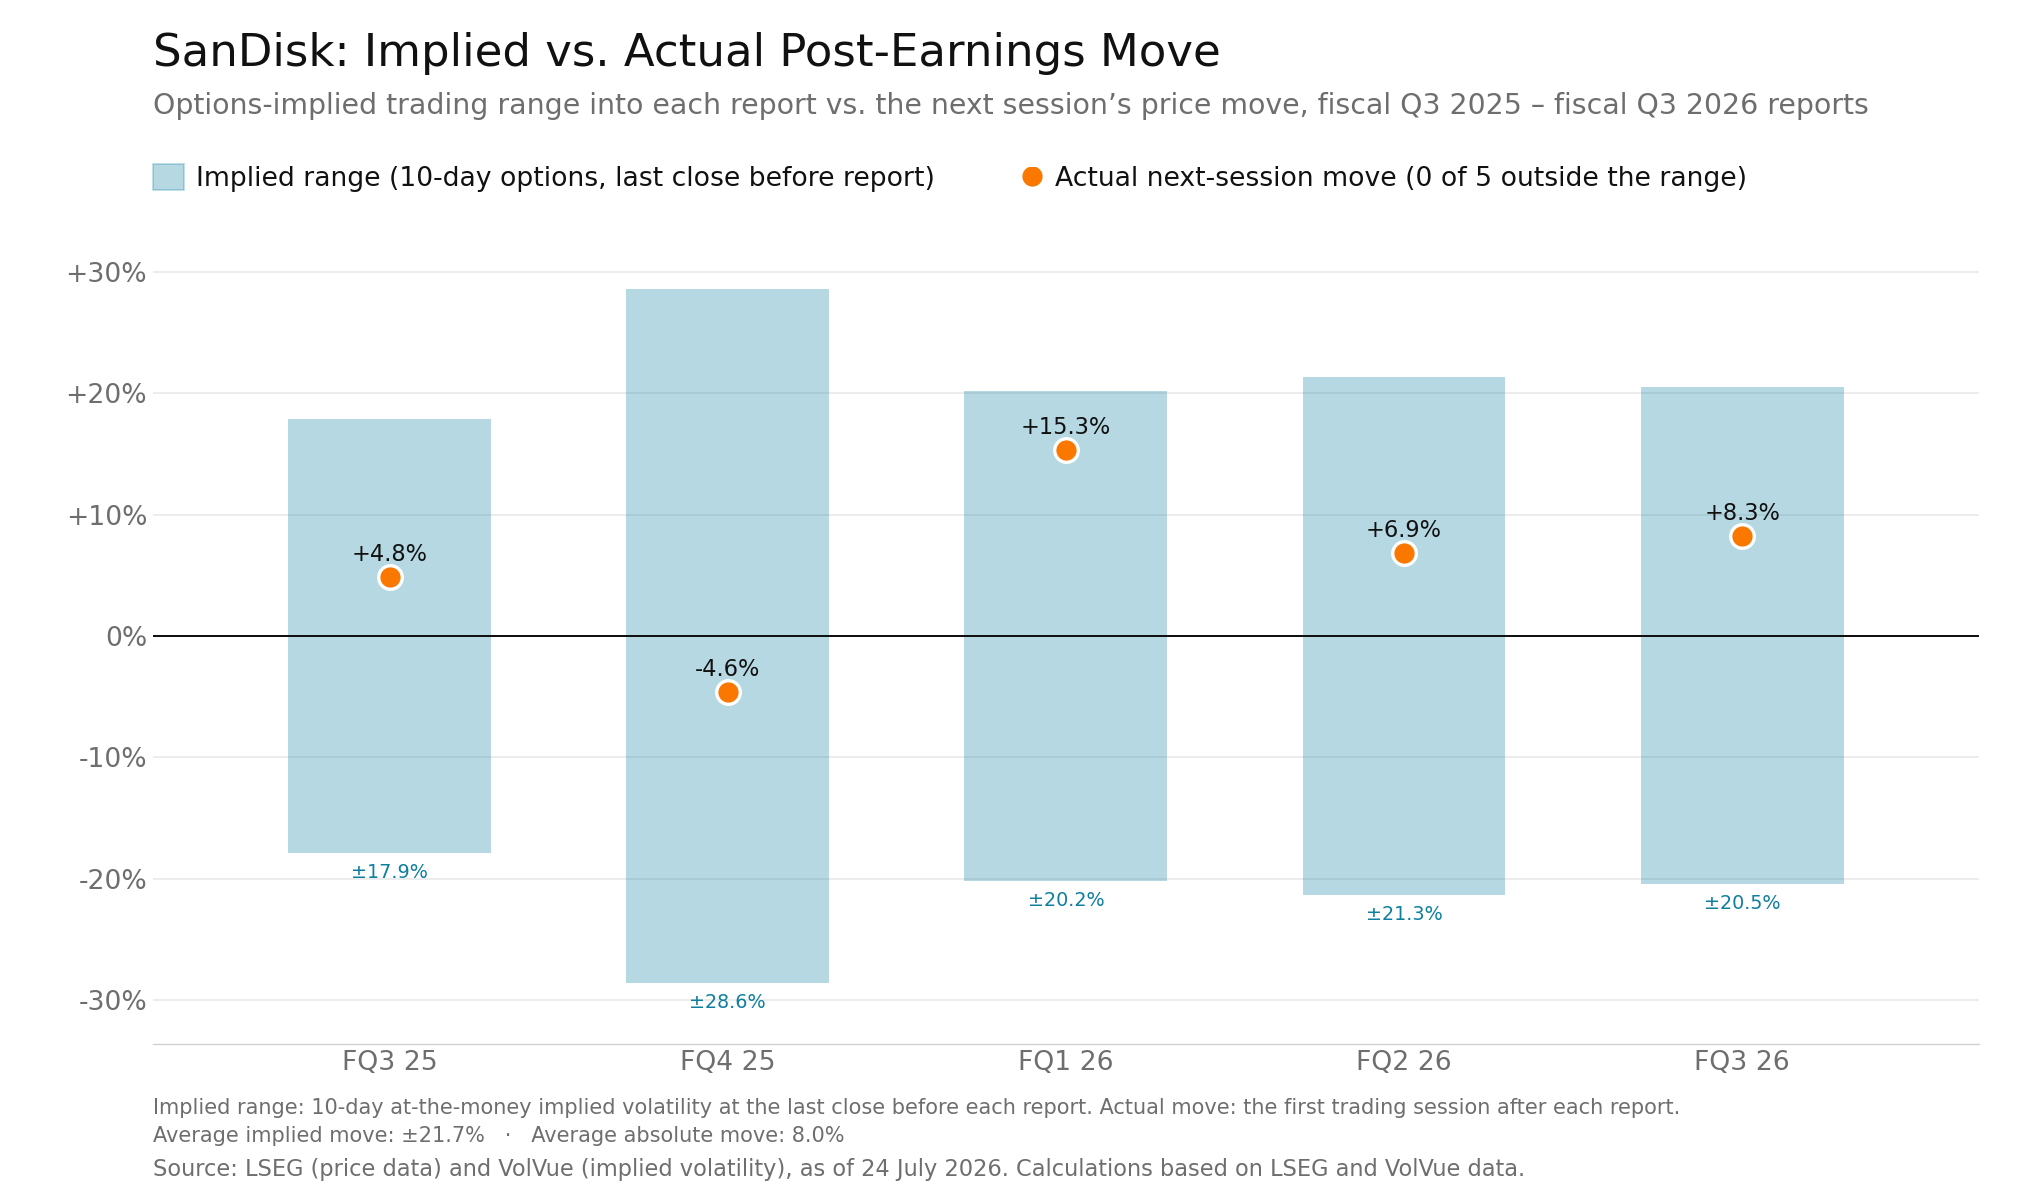
(Source: LSEG (price data) and VolVue (implied volatility), as of 24 July 2026. Calculations based on LSEG and VolVue data)
(Past performance is not a reliable indicator of future results)
Valuation Metrics
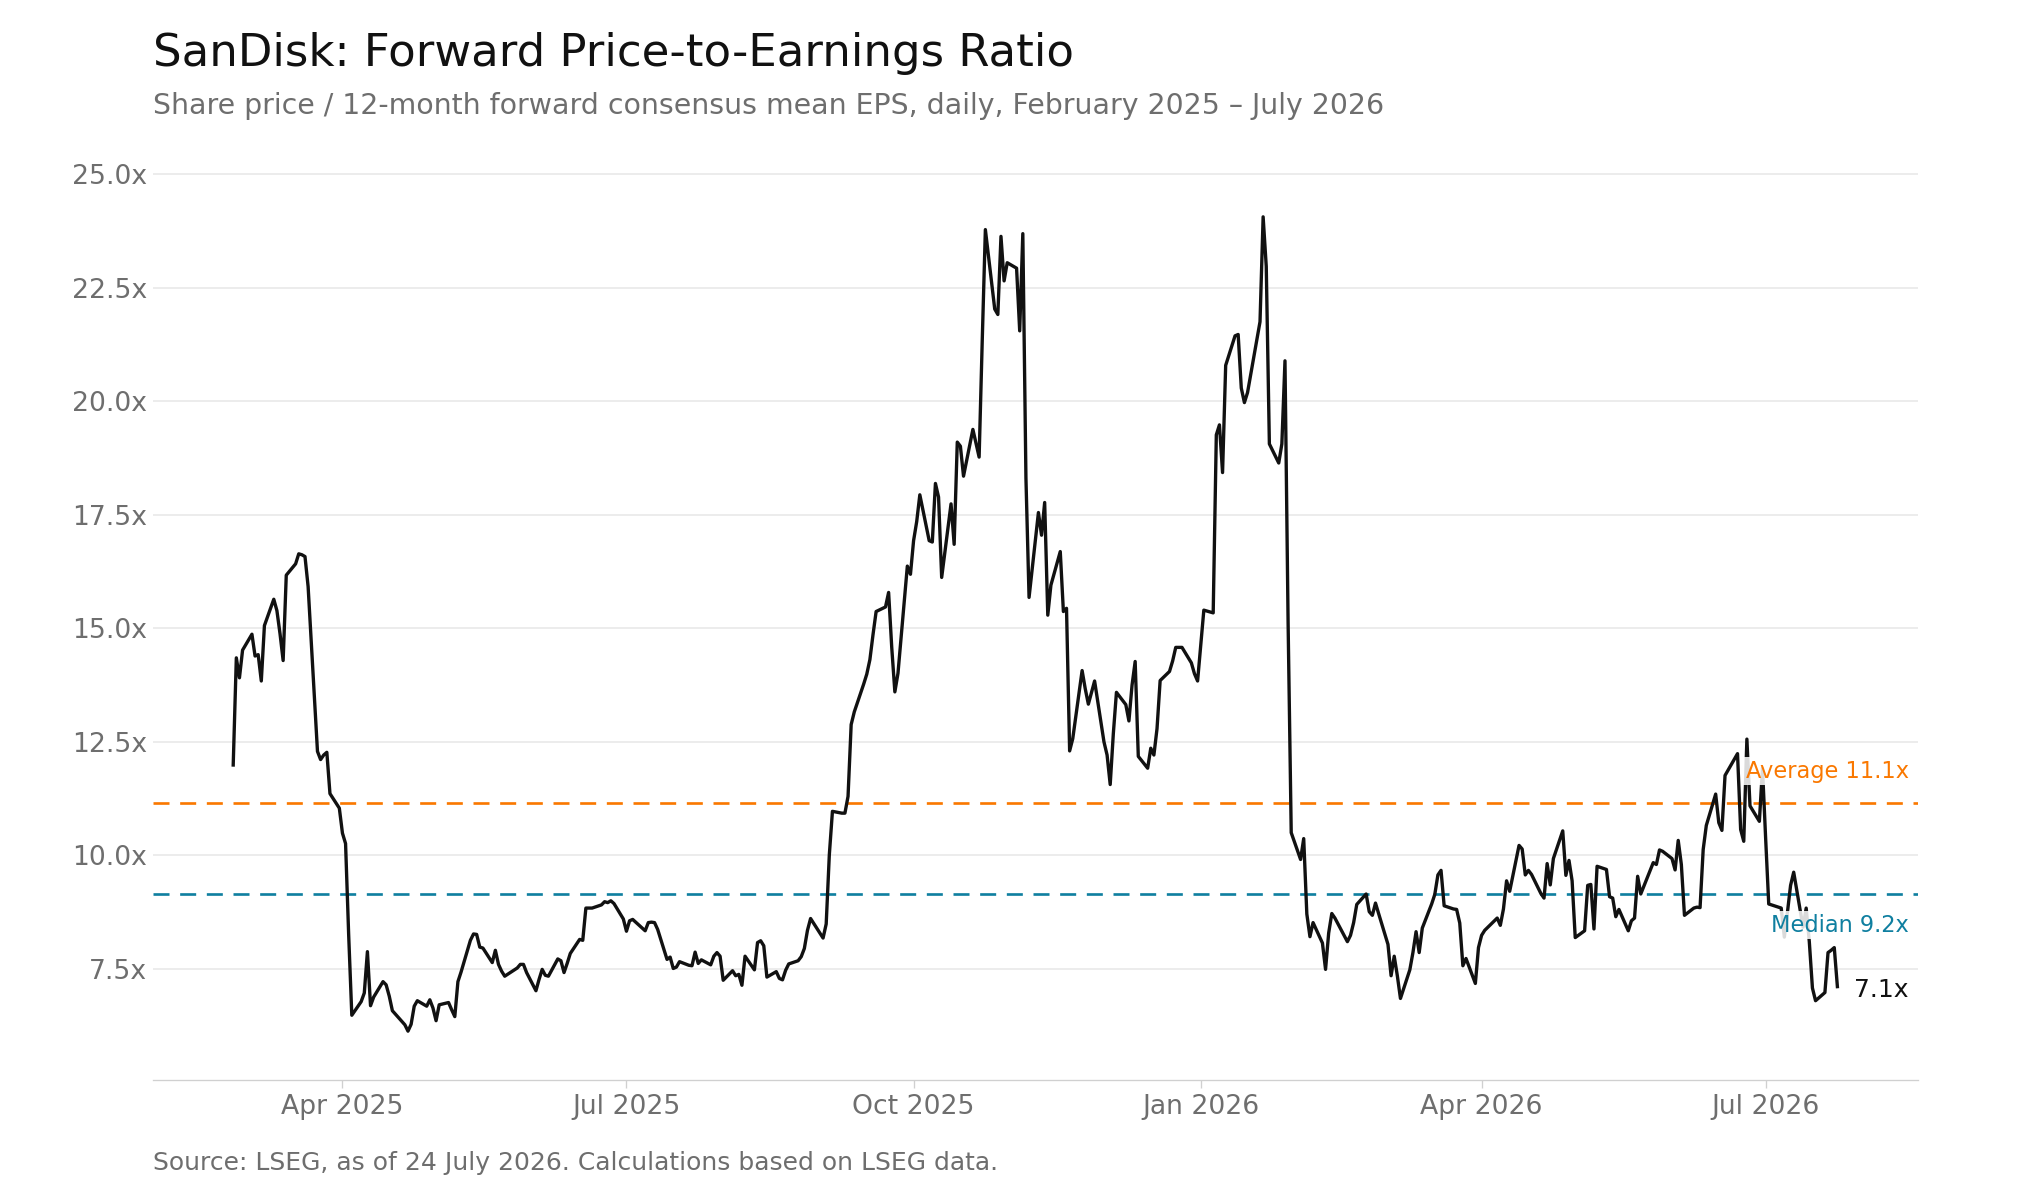
As of 24 July 2026, SanDisk’s forward price-to-earnings ratio, based on analysts’ estimates for the next 12 months, was 7.1. From February 2025 to July 2026, the average P/E was 11.1, and the median was 9.2, placing the 24 July observation below both measures for the period.
(Source: LSEG, as of 24 July 2026. Calculations based on LSEG data)
(Past performance is not a reliable indicator of future results)
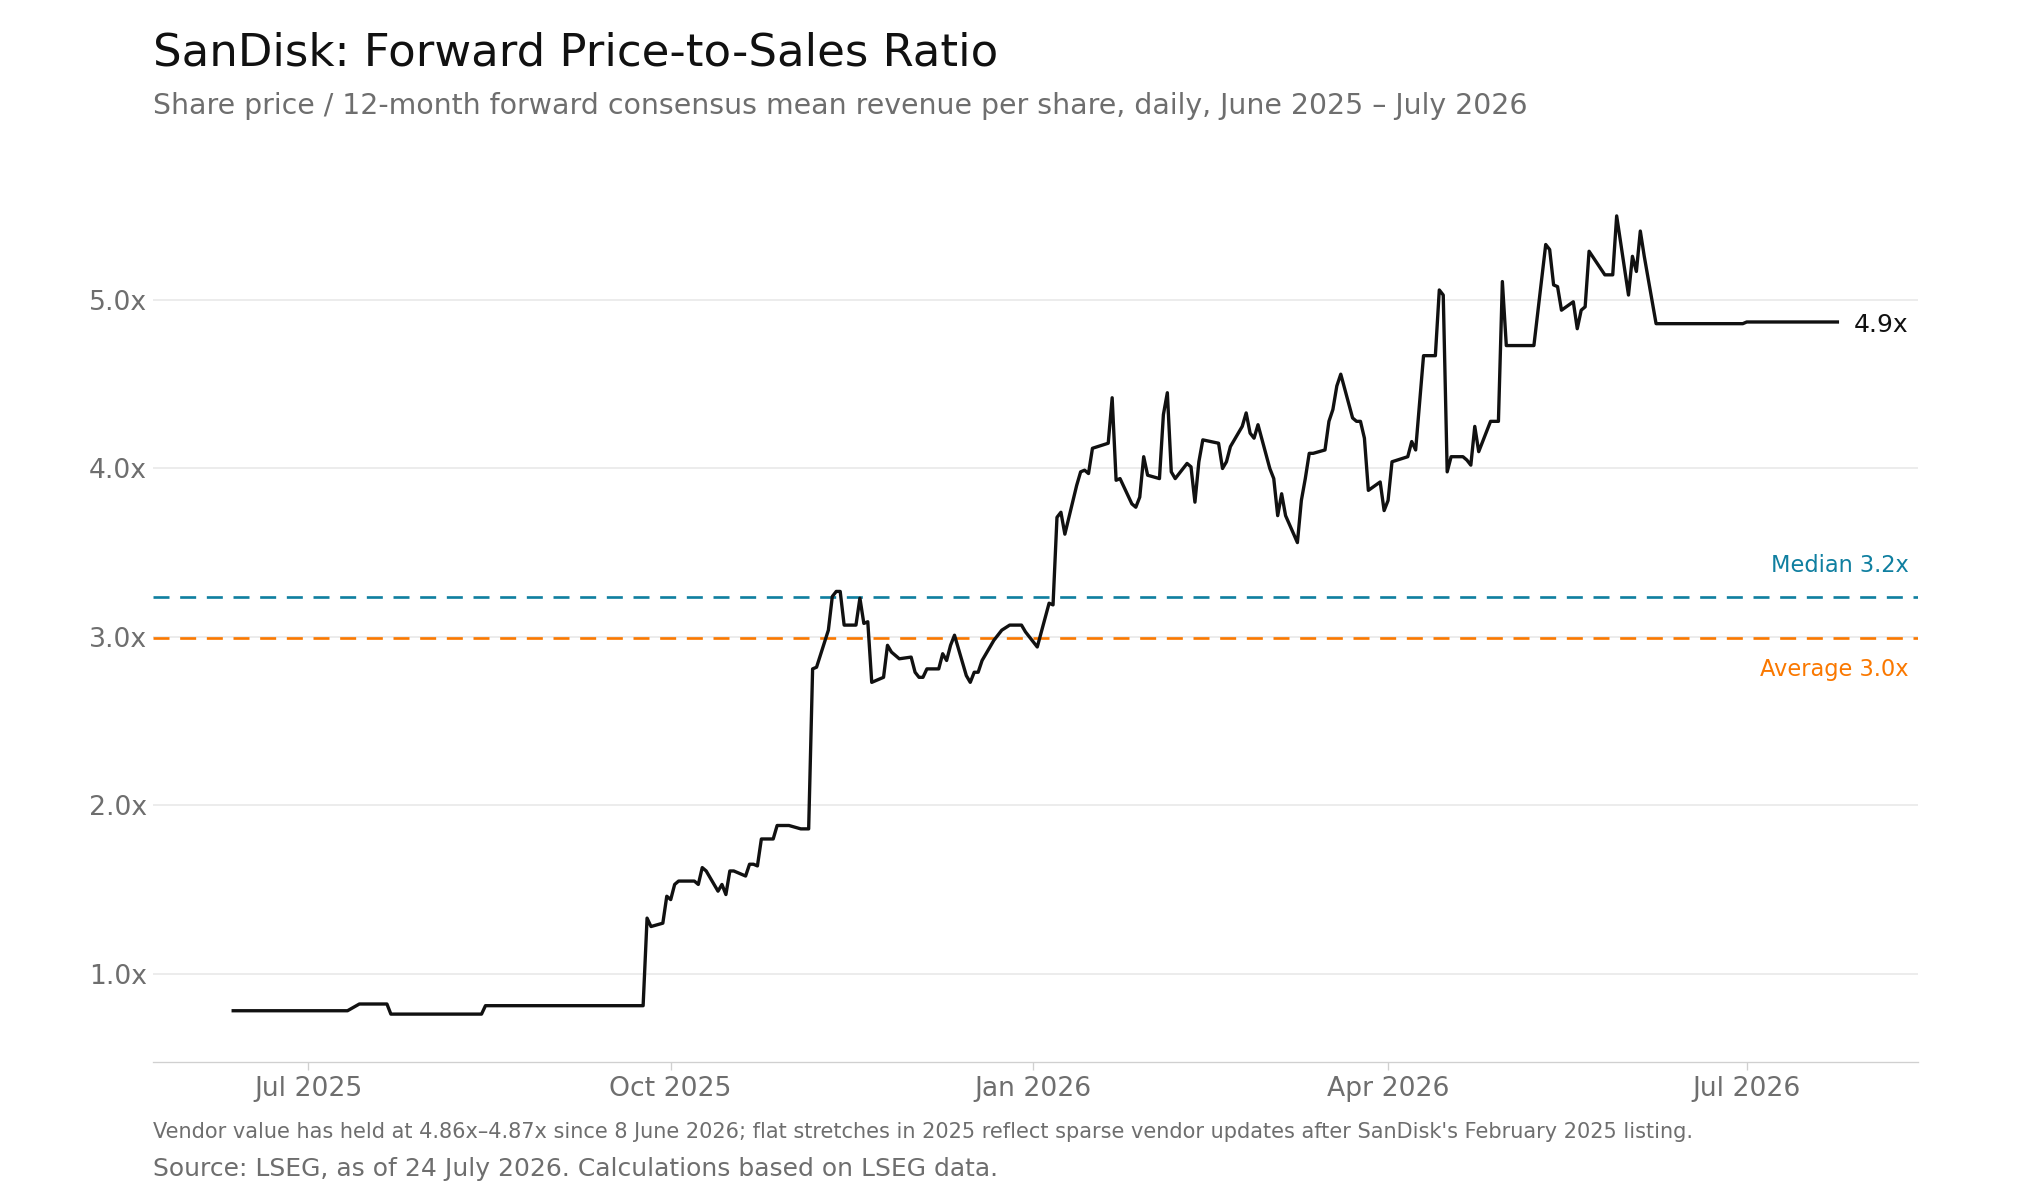
The latest available forward price-to-sales observation was 4.9 on 8 June 2026. From June 2025 to July 2026, the average P/S ratio was 3.0, and the median was 3.2, placing the latest observation above both measures for the period.
(Source: LSEG, as of 24 July 2026. Calculations based on LSEG data)
(Past performance is not a reliable indicator of future results)
Conclusion
The five reported quarters shown provide a limited historical sample. Over that period, SanDisk’s revenue increased in each quarter, while gross margin and free cash flow also rose.
As of 24 July 2026, forward P/E was below its average and median for the period shown. The latest available forward P/S observation, dated 8 June 2026, was above its corresponding average and median. These measures describe historical observations and do not provide a forecast for the next earnings announcement. Past performance is not a reliable indicator of future results.
Capital.com is an execution-only brokerage platform and the content provided on the Capital.com website is intended for informational purposes only and should not be regarded as an offer to sell or a solicitation of an offer to buy the products or securities to which it applies. No representation or warranty is given as to the accuracy or completeness of the information provided.
The information provided does not constitute investment advice nor take into account the individual financial circumstances or objectives of any investor. Any information that may be provided relating to past performance is not a reliable indicator of future results or performance.
To the extent permitted by law, in no event shall Capital.com (or any affiliate or employee) have any liability for any loss arising from the use of the information provided. Any person acting on the information does so entirely at their own risk.
Any information which could be construed as “investment research” has not been prepared in accordance with legal requirements designed to promote the independence of investment research and as such is considered to be a marketing communication.