

Apple near record highs: record iPhone sales, but memory costs could squeeze margins
Profits and revenues stay high for Apple while the hardware costs show signs of increase in the short-term.
In John Ternus's first quarter as CEO, Apple posted record September-quarter revenue of USD 114.5bn (+12%) and EPS of USD 2.10 (+14%), both above expectations. The market's attention, however, moved quickly to the December quarter. Apple guided gross margin to 45–46%, below the 46.9% analysts expected, as memory-chip prices rise at what Ternus called an "unprecedented" pace on the earnings call. On 3 November the shares opened 3.8% lower at USD 325.54 and closed at USD 331.90 (−1.9%). They then recovered, reaching a new all-time high of USD 355.38 during the session on 5 November, before closing at USD 344.17 (−1.5%). On 10 November they closed at USD 348.51 (−0.6%).
Key data
| Ticker / exchangeAAPL · Nasdaq | SectorTechnology | Market capUSD 5.06trn |
|---|---|---|
| Previous close (09/11)USD 350.69 | Close (10/11)USD 348.51 (−0.6%) | 52-week rangeUSD 243.42 – 355.38 |
| Dividend yield0.31% | Beta (5Y)1.09 | Next resultsLate Jan 2027 (TBC) |
Source: Yahoo Finance (close on 10/11/2026). Market cap based on 14,532m shares outstanding at 26/09/2026.
Past performance is not a reliable indicator of future results.
Overview
Apple's fiscal year ends in late September, so fiscal Q4 2026 covers July to September 2026. iPhone remains the core of the business: USD 57.6bn in the quarter, about 50% of revenue. Services (App Store, iCloud, Apple Music, Apple Pay, advertising and licensing) brought in USD 31.6bn, 28% of revenue, but with a gross margin of about 76% it generated around 44% of Apple's gross profit. Mac (USD 10.8bn), Wearables, Home and Accessories (USD 8.3bn) and iPad (USD 6.2bn) make up the rest. By region, the Americas account for 43% of revenue, Europe 28% and Greater China 15%. The new product cycle includes the iPhone Duo, Apple's first foldable iPhone, the iPhone 18 Pro range, an all-new Siri AI and Touch on the Mac. Unlike the cloud giants, Apple spends relatively little on capex (USD 9.0bn in fiscal 2026) and relies on third parties for part of its compute, which the company lists among its risk factors.
Profitability
In fiscal 2026 Apple posted record revenue and earnings: revenue of USD 478.8bn (+15%), net income of USD 132.2bn (+18%) and EPS of USD 8.98 (+20%). In Q4, iPhone grew 17% and Greater China 21%, while Services slowed to +9.8% from +12.1% in Q3. Gross margin was 47.9%, including about 1 percentage point from tariff refunds, and down from 50.1% in Q3. Operating margin was 31.1%, slightly below its two-year average of about 32%, as R&D rose 32% to USD 11.7bn. Free cash flow reached USD 136.1bn in the fiscal year, up 38%, helped by lower capex.
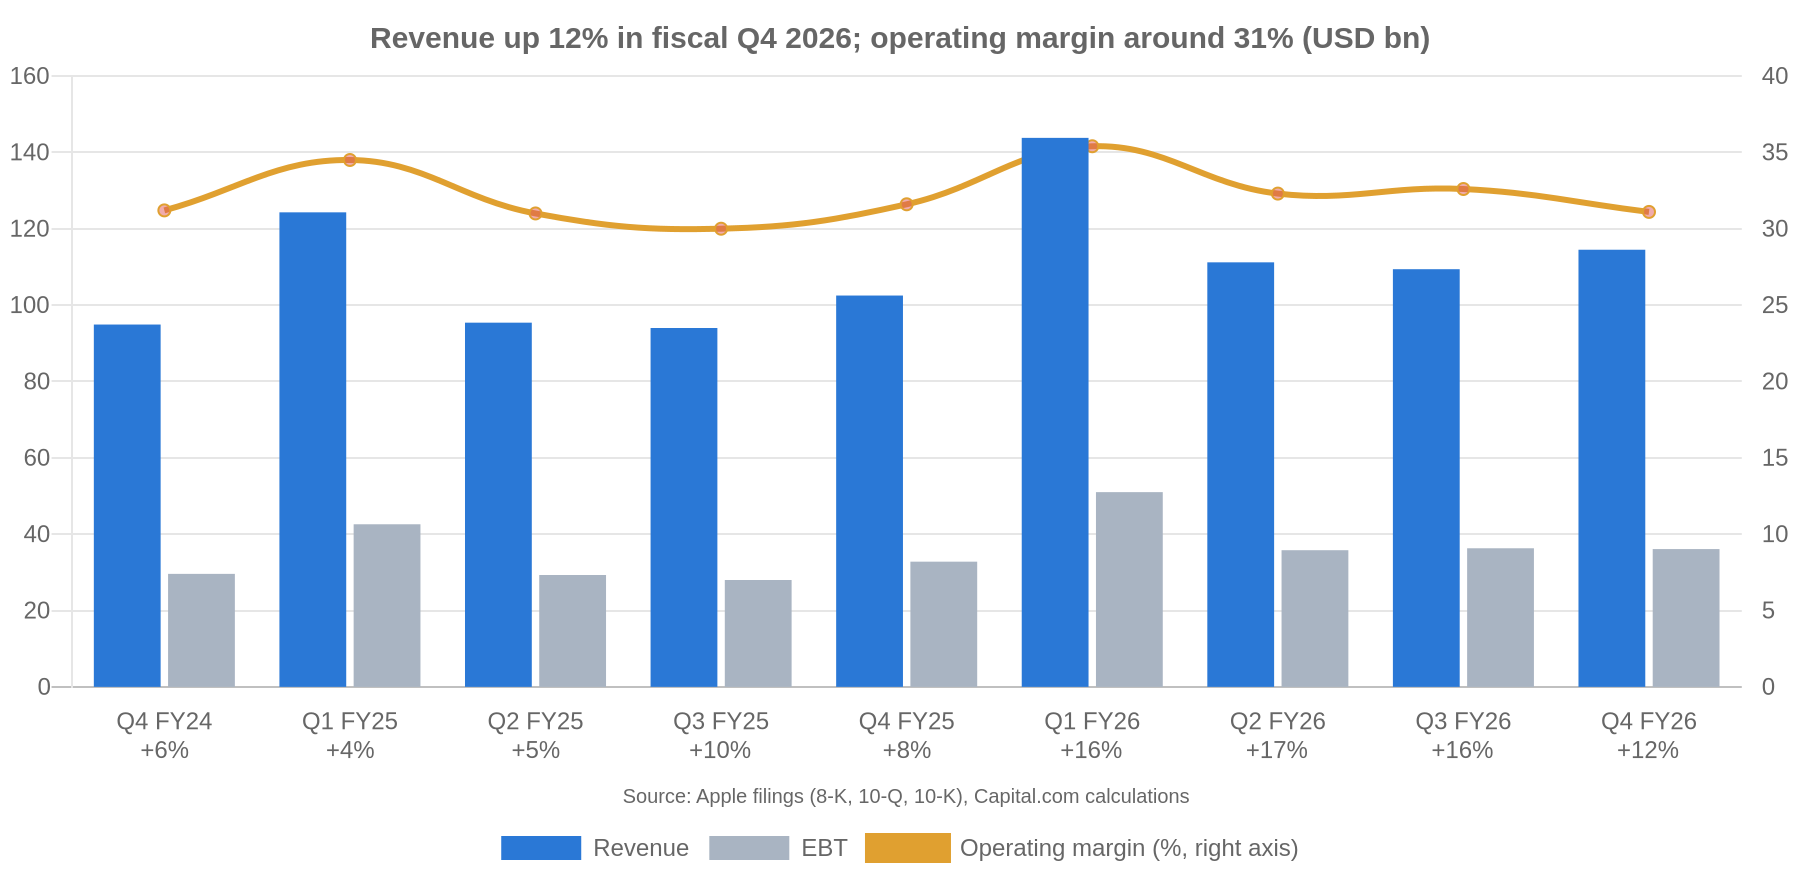
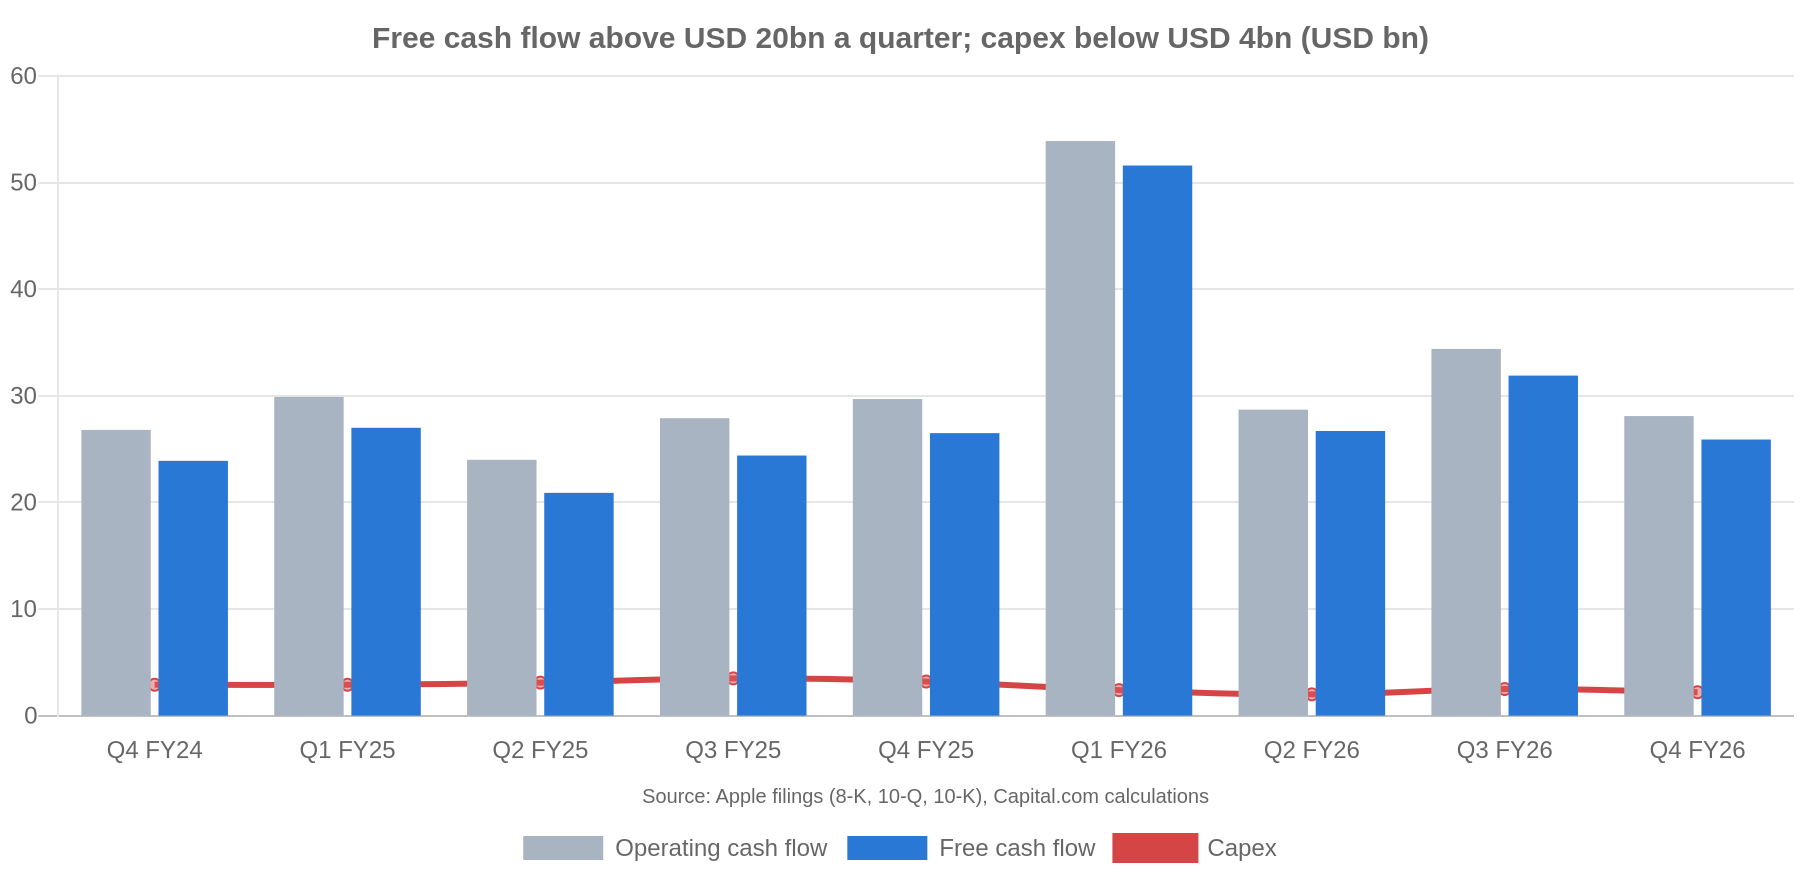
Source: Apple filings (8-K, 10-Q, 10-K), Capital.com calculations. USD bn. Fiscal quarters (fiscal year ends in late September). FCF = operating cash flow − payments for property, plant and equipment. Quarterly cash flows are derived from year-to-date figures; Q4 = full year − nine months.
Past performance is not a reliable indicator of future results.
Quarterly trend: Q/Q and Y/Y changes
| USD bn | Q4 FY24 | Q1 FY25 | Q2 FY25 | Q3 FY25 | Q4 FY25 | Q1 FY26 | Q2 FY26 | Q3 FY26 | Q4 FY26 |
|---|---|---|---|---|---|---|---|---|---|
| Revenue | 94.9 | 124.3 | 95.4 | 94.0 | 102.5 | 143.8 | 111.2 | 109.4 | 114.5 |
| % Q/Q | +10.7% | +30.9% | −23.3% | −1.4% | +9.0% | +40.3% | −22.7% | −1.6% | +4.6% |
| % Y/Y | +6.1% | +4.0% | +5.1% | +9.6% | +7.9% | +15.7% | +16.6% | +16.4% | +11.7% |
| EBT | 29.6 | 42.6 | 29.3 | 28.0 | 32.8 | 51.0 | 35.8 | 36.3 | 36.1 |
| % Q/Q | +16.1% | +43.8% | −31.2% | −4.4% | +17.0% | +55.5% | −29.7% | +1.2% | −0.4% |
| % Y/Y | +9.7% | +5.6% | +4.5% | +10.0% | +10.8% | +19.8% | +22.3% | +29.4% | +10.2% |
| Net income | 14.7 | 36.3 | 24.8 | 23.4 | 27.5 | 42.1 | 29.6 | 29.8 | 30.7 |
| % Q/Q | −31.3% | +146.5% | −31.8% | −5.4% | +17.2% | +53.3% | −29.7% | +0.7% | +3.1% |
| % Y/Y | −35.8% | +7.1% | +4.8% | +9.3% | +86.4% | +15.9% | +19.4% | +27.1% | +11.8% |
| Operating cash flow | 26.8 | 29.9 | 24.0 | 27.9 | 29.7 | 53.9 | 28.7 | 34.4 | 28.1 |
| % Q/Q | −7.1% | +11.7% | −20.0% | +16.3% | +6.7% | +81.4% | −46.8% | +19.7% | −18.2% |
| % Y/Y | +24.1% | −25.0% | +5.6% | −3.4% | +10.9% | +80.1% | +19.8% | +23.3% | −5.5% |
| Capex | 2.9 | 2.9 | 3.1 | 3.5 | 3.2 | 2.4 | 2.0 | 2.5 | 2.2 |
| % Q/Q | +35.2% | +1.1% | +4.5% | +12.7% | −6.4% | −26.8% | −16.9% | +24.6% | −8.7% |
| % Y/Y | +34.4% | +22.9% | +53.9% | +60.9% | +11.5% | −19.3% | −35.8% | −29.1% | −30.8% |
| Free cash flow | 23.9 | 27.0 | 20.9 | 24.4 | 26.5 | 51.6 | 26.7 | 31.9 | 25.9 |
| % Q/Q | −10.5% | +12.9% | −22.6% | +16.9% | +8.5% | +94.6% | −48.1% | +19.4% | −19.0% |
| % Y/Y | +23.0% | −28.0% | +0.9% | −8.6% | +10.8% | +91.0% | +28.0% | +30.8% | −2.4% |
| Gross margin | 46.2% | 46.9% | 47.1% | 46.5% | 47.2% | 48.2% | 49.3% | 50.1% | 47.9% |
| Operating margin | 31.2% | 34.5% | 31.0% | 30.0% | 31.6% | 35.4% | 32.3% | 32.6% | 31.1% |
Source: Apple filings (8-K, 10-Q, 10-K), Capital.com calculations. USD bn. Q/Q = change versus the previous quarter; Y/Y = change versus the same quarter a year earlier. Apple's revenue is seasonal (fiscal Q1, the holiday quarter, is the largest), so Y/Y changes are the better guide. Q4 FY24 net income includes a one-off tax charge of about USD 10.2bn related to the European Commission State Aid decision, which explains the +86% Y/Y in Q4 FY25. Q4 FY26 gross margin includes about 1 percentage point from tariff refunds.
Past performance is not a reliable indicator of future results.
Results vs consensus and guidance
Revenue and EPS both beat expectations, with EPS ahead of estimates for a fourth consecutive quarter, according to Yahoo Finance. The guidance for the December quarter was mixed: record revenue, but lower margins and slower Services growth.
| RevenueUSD 114.5bnBeat · est. 113.4bn (+1.0%) | Diluted EPSUSD 2.10Beat · est. 1.99 (+5.5%) | iPhone revenueUSD 57.6bn+17% Y/Y · September-quarter record |
|---|---|---|
| Services revenueUSD 31.6bn+9.8% Y/Y · from +12.1% in Q3 | Dec-quarter gross margin guide45–46%Below est. 46.9% | Dec-quarter revenue guide+7% to +10% Y/YServices +8% to +9% |
Source: Apple Q4 FY2026 earnings release; Investing.com (revenue and EPS estimates, guidance from the earnings call and gross margin estimate); Yahoo Finance (EPS surprise history).
Past performance is not a reliable indicator of future results.
Solvency
Apple ended fiscal 2026 with net cash of USD 56.8bn, up from USD 33.8bn a year earlier, as it repaid debt without new issuance. Total debt fell from USD 98.7bn to USD 80.1bn, and equity rose to USD 112.1bn, its highest level in the period shown. By comparison, between December 2025 and September 2026 Alphabet's long-term debt rose from USD 46.5bn to USD 125.1bn and Amazon's from USD 65.6bn to USD 173.1bn, according to the two companies' quarterly reports.
| Quarter end | Total debt | Cash + securities | Net cash | Equity | Net cash/TTM EBITDA | Current ratio |
|---|---|---|---|---|---|---|
| Sep 2026 | 80.1 | 136.9 | 56.8 | 112.1 | 0.33x | 1.02 |
| Jun 2026 | 84.3 | 146.5 | 62.2 | 107.5 | 0.37x | 1.00 |
| Mar 2026 | 84.7 | 146.6 | 61.9 | 106.5 | 0.39x | 1.07 |
| Dec 2025 | 90.5 | 144.8 | 54.3 | 88.2 | 0.36x | 0.97 |
| Sep 2025 | 98.7 | 132.4 | 33.8 | 73.7 | 0.23x | 0.89 |
| Jun 2025 | 101.7 | 133.0 | 31.3 | 65.8 | 0.22x | 0.87 |
| Mar 2025 | 98.2 | 132.9 | 34.7 | 66.8 | 0.25x | 0.82 |
| Dec 2024 | 96.8 | 141.4 | 44.6 | 66.8 | 0.32x | 0.92 |
Source: Apple balance sheets (10-K, 10-Q and 8-K releases), Capital.com calculations. USD bn. Quarter ends are Apple's fiscal quarter ends.
Past performance is not a reliable indicator of future results.
| Fiscal year end | Total debt | Cash + securities | Net cash | Equity | Net cash/EBITDA | Current ratio |
|---|---|---|---|---|---|---|
| FY2026 | 80.1 | 136.9 | 56.8 | 112.1 | 0.33x | 1.02 |
| FY2025 | 98.7 | 132.4 | 33.8 | 73.7 | 0.23x | 0.89 |
| FY2024 | 106.6 | 156.7 | 50.0 | 57.0 | 0.37x | 0.87 |
| FY2023 | 111.1 | 162.1 | 51.0 | 62.1 | 0.41x | 0.99 |
Source: Apple balance sheets (10-K and 8-K releases), Capital.com calculations. USD bn. Total debt = commercial paper plus current and non-current term debt. Cash + securities = cash and equivalents plus current and non-current marketable securities. EBITDA = operating income + depreciation and amortisation.
Past performance is not a reliable indicator of future results.
What happened. In fiscal 2026 Apple repaid USD 12.4bn of term debt and reduced commercial paper by USD 5.9bn, without issuing new bonds. Cash generated by operations rose 30% to USD 145.1bn, which covered USD 86.4bn of buybacks and USD 15.7bn of dividends. Inventories rose to USD 14.5bn, from USD 5.7bn a year earlier. That is consistent with the carry-in inventory Ternus said on the earnings call would help offset higher memory costs in the December quarter.
Read the figures with care. Apple's equity is low relative to its size because it has returned more cash than it earned for several years through buybacks; retained earnings only turned positive again in fiscal 2026. Current ratio near 1x reflects large supplier payables (USD 82.3bn), which is typical of Apple's working-capital model.
Litigation and regulation. The US Department of Justice antitrust lawsuit filed in March 2024 is moving towards a trial in 2027, after a judge refused to dismiss it in June 2025. In the EU, the European Commission fined Apple €500m under the Digital Markets Act in April 2025. The final judgment in the DoJ's Search case against Google (December 2025) restricts default-search distribution deals. Apple reports licensing revenue within Services.
Maturities and rating. USD 9.9bn of term debt is due within 12 months and USD 68.2bn later; commercial paper stood at USD 2.0bn. Apple is rated Aaa by Moody's and AA+ by S&P.
Shareholder returns
Apple returned USD 102.1bn to shareholders in fiscal 2026 through buybacks and dividends, about 75% of its free cash flow.
| USD bn | FY2023 | FY2024 | FY2025 | FY2026 |
|---|---|---|---|---|
| Share buybacks | 77.6 | 94.9 | 90.7 | 86.4 |
| Dividends paid | 15.0 | 15.2 | 15.4 | 15.7 |
| Stock-based compensation | 10.8 | 11.7 | 12.9 | 13.8 |
| Free cash flow | 99.6 | 108.8 | 98.8 | 136.1 |
Source: Apple cash flow statements (10-K and 8-K releases), Capital.com calculations.
Past performance is not a reliable indicator of future results.
Shares outstanding fell from 14,773m to 14,532m during the fiscal year, a reduction of 1.6%, which is why EPS (+20%) grew faster than net income (+18%). The quarterly dividend is USD 0.27 per share, a 0.31% yield and a payout of about 12% of fiscal 2026 earnings. Stock-based compensation was USD 13.8bn, about 2.9% of revenue.
Relative valuation and competition
Apple's trailing P/E of 39x and forward P/E of 36x are the highest in this peer group, while consensus expects the slowest revenue growth of the five next year (+9.9%).
| Company | TTM P/E | Forward P/E | Est. revenue growth, next year |
|---|---|---|---|
| Apple (AAPL) | 38.8x | 36.3x (FY to Sep 2027) | +9.9% (FY2027) |
| Microsoft (MSFT) | 27.8x | 26.6x (FY to Jun 2027) | +19.3% (FY2027) |
| Alphabet (GOOGL) | 15.0x | 19.2x (2027) | +27.6% (2027) |
| Amazon (AMZN) | 21.9x | 25.4x (2027) | +15.8% (2027) |
| Meta (META) | 21.9x | 18.9x (2027) | +21.7% (2027) |
Source: Yahoo Finance (closing prices on 10/11/2026; average consensus estimates as of 11/11/2026, Apple as of 03/11/2026), Capital.com calculations. Alphabet's and Amazon's trailing P/E are inflated by gains on equity stakes.
Past performance is not a reliable indicator of future results.
Other Apple multiples: TTM EV/EBITDA is about 29x, price-to-sales about 10.6x and price-to-FCF about 37x. Consensus expects EPS of USD 9.59 in fiscal 2027, up about 7% on fiscal 2026.
Competition.
- Smartphones: Samsung and Chinese brands such as Huawei and Xiaomi compete with iPhone, including in foldables, where Apple is a newer entrant with the iPhone Duo.
- AI: Google, Microsoft and Meta are investing heavily in their own models and infrastructure, while Apple has taken a more cautious approach, emphasising privacy and security, according to Ternus's comments on the earnings call.
- Services: the App Store faces regulatory pressure in the US and the EU, and mobile gaming, a key App Store category, has been weak, according to management.
- PCs and tablets: Mac grew 24% in Q4, while iPad fell 10%, against competition from Windows and Android devices.
Analyst consensus. The average price target is USD 340.77, in a range of USD 250 to USD 405, according to data compiled by Yahoo Finance (11/11/2026). On 03/11, the fiscal 2027 EPS estimate stood at USD 9.59, against USD 9.55 90 days earlier. On 4/11, Bernstein raised its target from USD 370 to USD 380, according to Yahoo Finance. These targets reflect the views of third-party analysts, not Capital.com.
Catalysts and risks
The next big test is the December-quarter results in late January, the first full quarter of iPhone Duo sales.
Catalysts
- The iPhone Duo and iPhone 18 Pro cycle, and whether supply catches up with demand.
- Management's guidance for record December-quarter revenue, up 7% to 10%.
- The rollout of the all-new Siri AI and any further detail on Apple's AI strategy.
- Continued demand in Greater China, where revenue grew 21% in Q4 and 28% in fiscal 2026.
- Shareholder returns: Apple returned USD 102.1bn through buybacks and dividends in fiscal 2026 and ended the year with USD 56.8bn of net cash.
Risks
- Memory-chip costs: management expects prices to keep rising beyond the December quarter, which could weigh on margins.
- Supply constraints on the iPhone Duo; the COO said it is hard to predict when supply and demand will balance.
- Slower Services growth, and regulation: the DoJ antitrust case, the EU Digital Markets Act and the remedies in the Google Search case.
- Geopolitics and tariffs, given Apple's supply chain in Asia and its exposure to Greater China (15% of revenue).
- Execution under a new CEO and the rollout of Apple's AI strategy, including the all-new Siri.
Technical analysis
Apple's shares remain in an uptrend in 2026. In April, they broke above the downward line from the December 2025 high (orange circle). More recently, after the results, they opened 3.8% lower on 3 November, at USD 325.54, and closed at USD 331.90. On 4 November they rose 5.3%, and on 5 November they reached a new all-time high of USD 355.38 during the session, above the October highs near USD 350–352, before closing at USD 344.17. The resistance area is between around USD 345 and USD 355, formed by the July and October highs and the 5 November all-time high: the shares closed inside it on 4, 9 and 10 November (USD 349.51, USD 350.69 and USD 348.51), and traded above it during the session on 5 November, at USD 355.38. The 5 November move stands out: the shares hit a new all-time high of USD 355.38 but were rejected strongly at that level and closed at USD 344.17. Below, the 50-day simple moving average (yellow line) stands near USD 338, and the first price support is near USD 326, the 3 November low (USD 325.33). Further down are the 150-day simple moving average (orange line, near USD 313), the 200-day simple moving average (red line, near USD 300) and the area of the February and April 2026 lows, around USD 243, which coincides with the rising trendline (blue line).
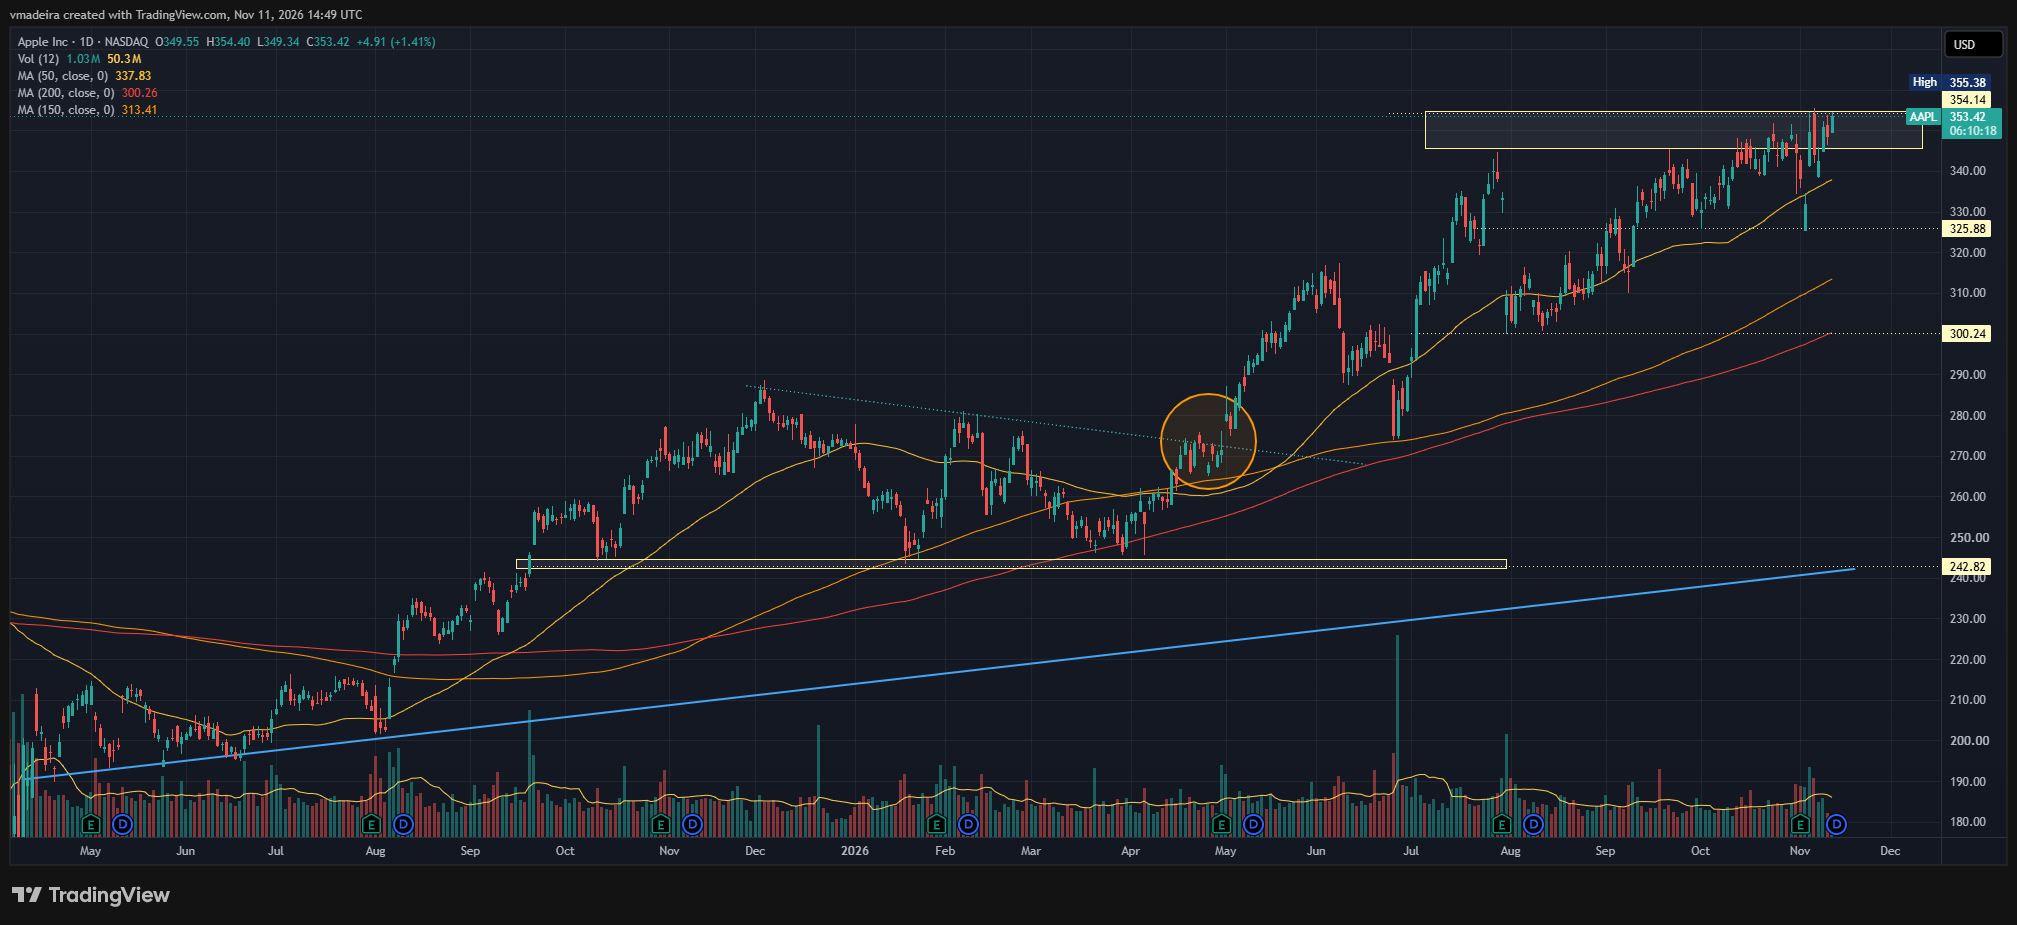
Source: TradingView (Capital.com), daily chart, AAPL, May 2025 to November 2026; intraday data on 11/11/2026 (chart taken at 14:49 UTC). Moving averages: 50-day (yellow), 150-day (orange) and 200-day (red).
Past performance is not a reliable indicator of future results.
Reference data: 52-week range USD 243.42–355.38; close on 03/11 USD 331.90 (−1.9%), after an open of USD 325.54 (−3.8%); close on 04/11 USD 349.51 (+5.3%); close on 05/11 USD 344.17 (−1.5%), after a session high of USD 355.38; close on 06/11 USD 342.37 (−0.5%); close on 09/11 USD 350.69 (+2.4%); close on 10/11 USD 348.51 (−0.6%); 03/11 intraday low USD 325.33; 50-, 150- and 200-day simple moving averages near USD 338, USD 313 and USD 300 (TradingView, Capital.com).
Summary
Apple posted record revenue and EPS in fiscal 2026, but rising memory costs and slower Services growth are now the market's focus.
Strengths
- Record fiscal year: revenue of USD 478.8bn (+15%) and EPS of USD 8.98 (+20%).
- iPhone up 17% in Q4 and Greater China up 21%.
- Free cash flow of USD 136.1bn, net cash of USD 56.8bn and USD 102.1bn returned to shareholders.
Factors to watch
- December-quarter gross margin guided to 45–46%, below expectations, on memory costs.
- Services growth slowing to 8–9%.
- Supply constraints on the iPhone Duo and the pace of Apple's AI rollout.