Fair value gap trading strategy: How to identify and use FVGs
Discover how fair value gaps (FVGs) work, what they might reveal about price action, and how traders use them to spot potential entry and exit points in CFD markets.
What is the fair value gap (FVG) trading strategy?
The fair value gap (FVG) strategy helps traders spot short-term price imbalances on a chart – often caused by sudden buying or selling pressure. These gaps typically form during periods of heightened volatility, and appear as a three-candle pattern.
Unlike balanced market areas – where consecutive candles show overlapping wicks and a fair exchange between buyers and sellers – an FVG signals a disruption. Specifically, it appears when part of the middle candle’s range isn’t touched by the candles before or after it. This creates a visible ‘gap’ and suggests that one side temporarily dominated the order flow.
Traders may interpret these gaps as potential zones of interest, where the market could revisit to ‘fill’ the inefficiency. However, like all chart patterns and strategies, an FVG doesn’t guarantee any particular outcome.
How do you identify an FVG on a chart?
A fair value gap (FVG) is an area on a price chart where an imbalance occurs, meaning part of a price move is not overlapped by trading activity in the surrounding candles – indicating an area where buying or selling was temporarily dominant, and leaving an unfilled zone.
Identify an FVG by observing the following pattern across three consecutive candles:
1. Find three consecutive candles
Examine your price chart and select any group of three consecutive candles. Focus on the second (middle) candle in this group.
2. Compare candle ranges
Compare the price range of each candle, from the lowest wick to the highest wick, to determine whether the central candle’s range is not fully overlapped by the wicks of the first and third candles.
-
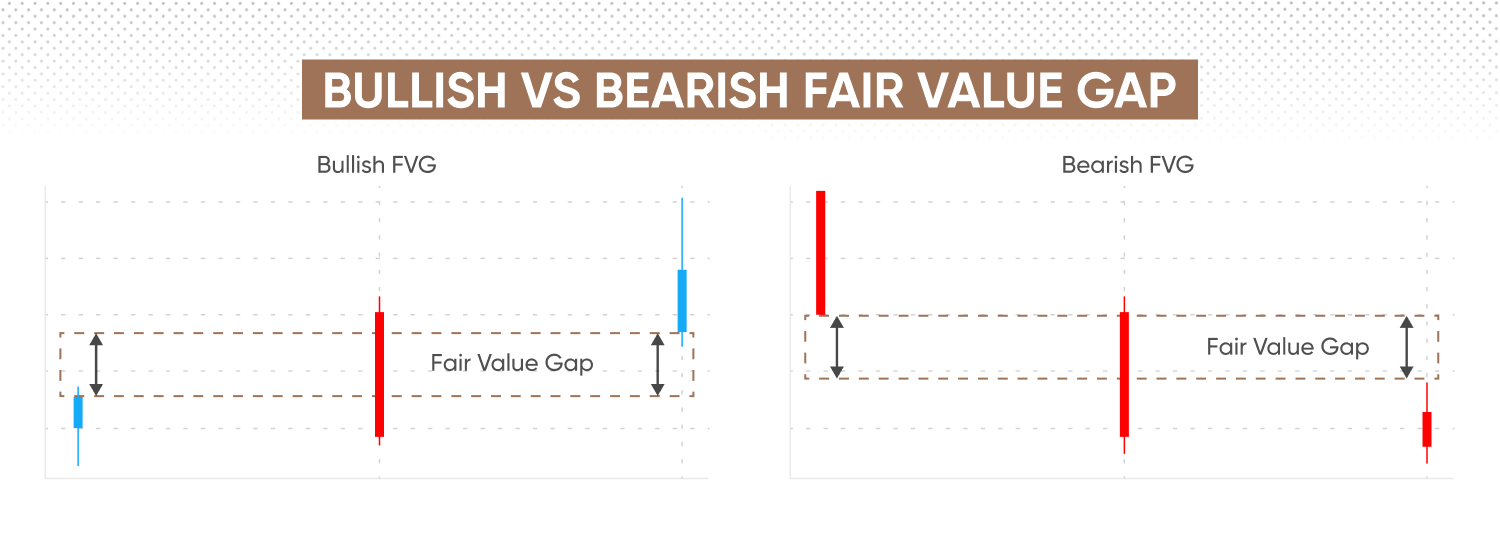
Bullish FVG: the low of the third candle is higher than the high of the first candle, leaving a portion of the middle candle’s range untraded.
-
Bearish FVG: the high of the third candle is lower than the low of the first candle, resulting in an unfilled area within the range of the middle candle.
3. Mark the gap on the chart
Highlight the section of the middle candle’s range that is not overlapped by the first and third candles. This area represents the fair value gap, indicating a price imbalance.
4. Confirm the gap
Confirmation can help distinguish valid FVGs from gaps that are less likely to affect price behaviour:
-
Observe whether price returns to the gap and reacts (eg, stalls, reverses, or forms a rejection candle).
-
Check for an increase in trading volume as price approaches the gap.
-
Look for additional technical signals (such as support or resistance levels) that align with the gap.
FVG trading example
Let’s say you’re looking at a one-hour EUR/USD chart and spot a bullish fair value gap. This appears as three consecutive candles where the low of the third candle is above the high of the first. A portion of the middle candle’s range remains untouched – a common signature of an FVG.
Some traders mark this area as a potential ‘imbalance zone’, anticipating that price might retrace to it later. The idea is that the market could revisit the level to restore balance. But it’s important to remember: past patterns don’t guarantee future results.
While many traders identify fair value gaps by eye, technical indicators can help streamline the process – especially when monitoring multiple markets or timeframes.
Fair value gaps vs regular gaps: How do they differ?
Fair value gaps and regular gaps both appear as empty spaces on price charts but differ significantly in their formation, trading implications, and market dynamics.
Here’s how they compare:
|
Fair value gap (FVG) |
Regular gap |
|
|
Formation |
Occurs during rapid, directional price moves, where a three-candle sequence leaves part of the middle candle’s range untraded. |
Occurs when there is a price jump between candles, possibly at market open or after news events. |
|
Chart identification |
Identified when part of a candle’s range is left untraded – forming a gap in the sequence – but not between closing and opening prices. |
Clear gap between closing and opening prices of adjacent candles. |
|
Market dynamics |
Indicates short-term price imbalance or inefficiency, which may attract attempts to fill the gap. |
Signals sudden shifts in market sentiment or liquidity disruptions. |
CFD traders can identify fair value gaps on intraday charts, such as the 15-minute or 1-hour, where continuous trading allows for visible imbalances. By contrast, regular gaps are most prominent on daily charts – potentially resulting from overnight closures or major news.
How to trade FVGs with support & resistance analysis
Combine fair value gap (FVG) trading with support and resistance analysis to provide additional structure to your trading decisions. Here are some straightforward steps:
- 1. Identify support and resistance zonesStart by clearly marking support and resistance levels on your trading chart. These zones represent areas where price has previously paused, reversed, consolidated, or reached significant round numbers. Recognising these levels may help you anticipate where the price might retrace into an FVG, especially when the FVG is located near one of these zones.
- 2. Align FVGs with support and resistanceFocus on FVGs that appear close to support or resistance. Significant FVGs typically occur on higher timeframes, especially where there is strong liquidity. For instance, if you observe a bullish FVG just above a support zone, it may indicate a potential buying opportunity.
- 3. Confirm entry using price actionBefore entering a trade, look for additional confirmation through price action signals or chart patterns. Examples include a bullish engulfing candle forming at support within a bullish FVG, or a bearish pin bar appearing at resistance within a bearish FVG.
- 4. Manage risk with clearly defined levelsSet stop-loss orders logically in relation to the relevant support or resistance area. For a bullish FVG near support, for example, a stop-loss could be placed just below the support level. Keep in mind that, due to margin requirements and volatility in CFD markets, stop-losses may not always guarantee an exit at your specified price – guaranteed stop-losses are available, though they incur fees.
Discover more in our support and resistance (S&R) guide
Best indicators and timeframes for FVG trading
Selecting appropriate indicators and timeframes can underpin an effective FVG strategy. Here are some potential tools and chart intervals for CFD traders:
Indicators
-
Volume profile: identifies price levels with the highest traded volume, which can act as support or resistance.
-
Moving averages (MAs): commonly used periods, such as the 50-period and 200-period moving averages, serve as dynamic support or resistance levels.
-
Relative strength index (RSI): a momentum indicator that signals when an asset is potentially overbought or oversold.
Optimal Timeframes
-
15-minute & 1-hour charts: these shorter timeframes support the identification of short-term price imbalances.
-
Daily charts: allow FVGs to be analysed alongside longer-term support and resistance levels.
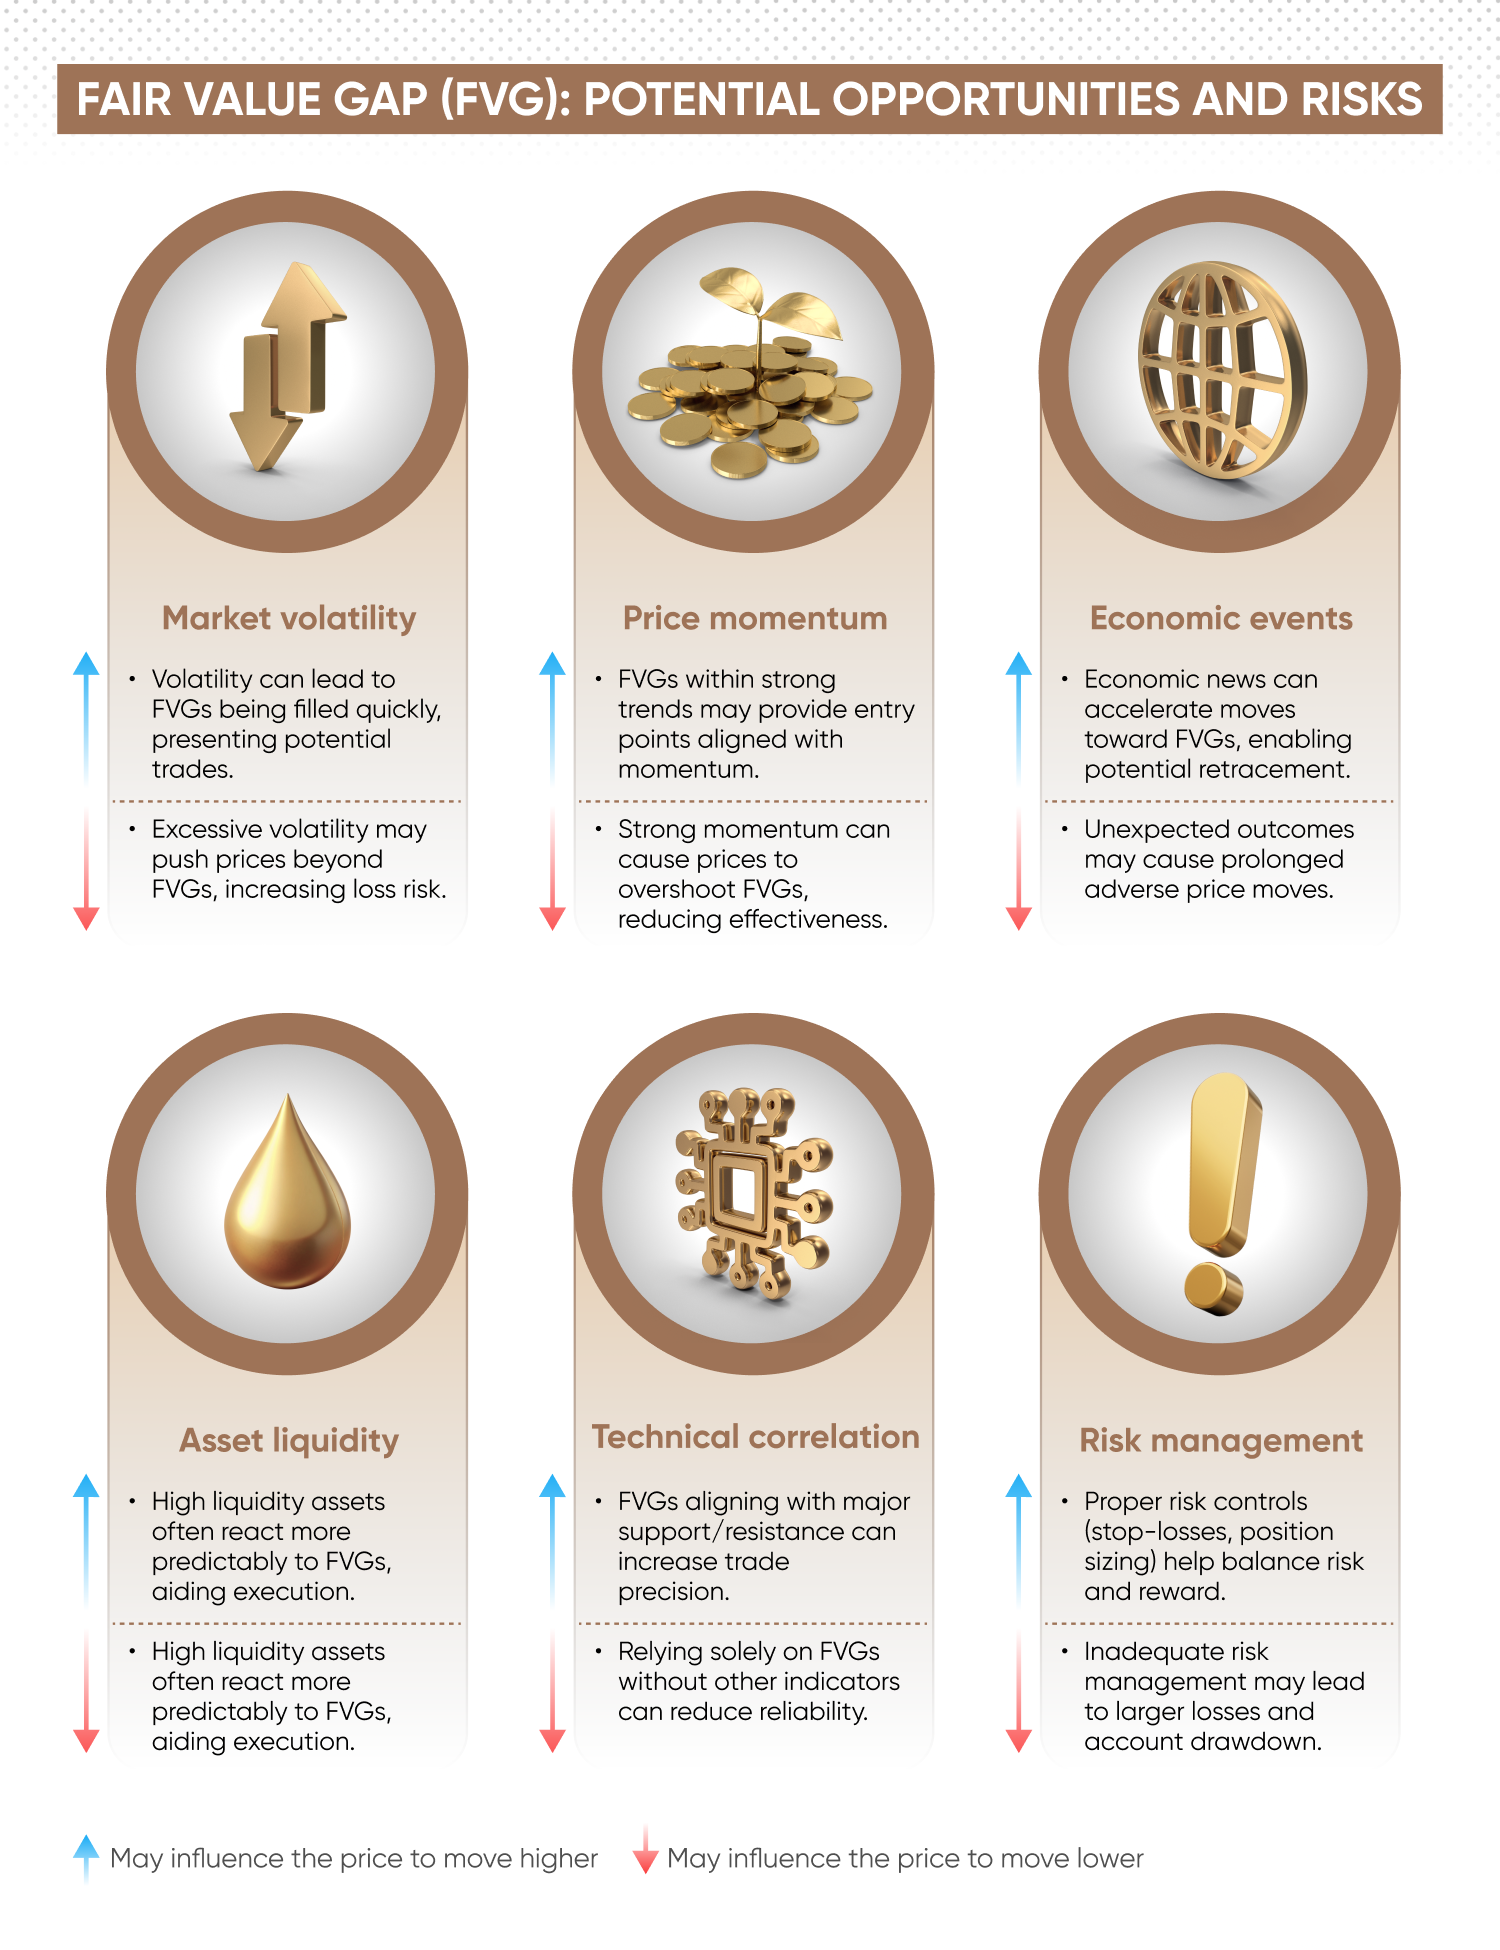
FVG trading strategy: Potential opportunities and risks
FVG trading brings its own mix of potential opportunities and risks, which CFD traders can weigh up as they plan their approach.
Market volatility
Periods of elevated market volatility can fill FVGs and cause new gaps to form, creating potential trading opportunities. However, excessive volatility can render FVG signals less reliable, as price may move sharply through or beyond these zones.
Price momentum
FVGs identified within strong market trends may offer entry points that follow the prevailing direction. Nevertheless, pronounced momentum can cause prices to bypass or overshoot FVG levels, reducing their effectiveness in some market conditions.
Economic events
Major economic announcements can accelerate price movement towards or through FVG areas. Such fundamentals might support potential breakouts or retracements, but unexpected outcomes may result in prolonged adverse moves.
Asset liquidity
Assets with high liquidity, such as major currency pairs or popular equities, tend to react more predictably to FVGs. Less liquid markets may exhibit erratic price behaviour, raising the risk of slippage and uncertain execution.
Correlation with technical levels
FVGs that coincide with established support or resistance levels may enhance trade precision. Relying solely on FVGs, without confirmation from other technical indicators, can reduce reliability.
Risk management
Apply risk management – such as predetermined stop-loss orders and appropriate position sizing – when trading FVGs to balance opportunities against inherent market risks.
 Past performance is not a reliable indicator of future results.
Inverse fair value gaps explained
Inverse fair value gaps (inverse FVGs) are a way to interpret how price reacts to an existing FVG. They highlight a scenario where price retraces into a fair value gap and decisively rejects the gap, indicating that the imbalance zone remains significant as support or resistance.
An inverse FVG might be identified when price revisits an established FVG and sharply rejects this area – effectively ‘bouncing’ away from the imbalance zone, showing that it continues to exert influence.
Here’s how to identify an inverse FVG:
-
Locate existing FVG zones – begin by clearly identifying previously formed fair value gaps.
-
Monitor price retracement – observe price action as it returns to a marked FVG zone.
-
Identify rejection – an inverse FVG is confirmed when price clearly rejects the gap zone, often shown by a candlestick reversal pattern or a prominent wick.
Inverse FVG example
Imagine GBP/USD previously formed a bullish fair value gap between 1.2600 and 1.2620. Later, the price retraces into this zone but quickly bounces away – perhaps leaving a long lower wick on the hourly chart. This kind of reaction can be seen as an inverse FVG.
In bullish cases, the former gap may act as a support level. In bearish scenarios, a similar gap might serve as resistance. Some traders view this behaviour as a possible signal – either for long entries if the broader uptrend continues, or for short entries if the market resumes a downward move.
As always, it’s important to combine such patterns with other analysis methods. No single signal guarantees a specific outcome.
Practical application
Trading inverse FVGs aligns well with traditional support and resistance strategies. Additional confirmation can be sought through candlestick patterns, volume changes, or indicator signals. While inverse FVGs can help identify precise entry points, effective risk management remains essential.
For more approaches, visit our CFD trading strategies page
Steps to automate and backtest FVG strategies
Automating and backtesting FVG strategies support enhanced precision and consistency in CFD trading. Platforms for this process include MetaTrader 4 (MT4) and TradingView , both of which offer accessible interfaces and a comprehensive range of tools.
Here are five steps to automate and backtest your FVG strategy:
-
Select your platform: MT4 provides Expert Advisors (EAs), enabling advanced automation, while TradingView offers straightforward scripting and visual alert functions*. Both options provide extensive support through community resources.
-
Define trading rules: set out clear, objective rules for your FVG strategy, covering entry and exit points as well as risk management parameters.
-
Create or source a script: implement your strategy by developing an automated script – using MQL4 for MT4 – or by adapting existing scripts available within each platform’s libraries.
-
Conduct backtests: use the Strategy Tester in MT4 or TradingView to evaluate your strategy’s performance against historical data.
-
Optimise and refine: review the backtesting results in detail to identify areas for improvement, adjusting parameters such as FVG size or timeframe.
*TradingView does not natively support direct trade automation without third-party integrations.
FAQs
What is an FVG in trading?
A fair value gap (FVG) refers to a price imbalance on a chart where price action leaves a range between candles structurally untraded, often visible as a gap between the wick or body of one candle and that of another, typically two candles apart.
How can I use fair value gaps in my trading strategy?
Integrate fair value gaps into your trading strategy by identifying FVGs on a price chart and waiting for retracements into these zones. Combine these gaps with support and resistance analysis or indicators such as liquidity zones, volume profile, or RSI for additional confirmation, making sure you apply clear risk management practices like stop-loss orders.
What is the best timeframe to trade FVGs?
The most effective timeframes for FVG trading depend on your trading style. For instance, intraday traders might find 5-minute, 15-minute and 1-hour charts optimal for capturing short-term price imbalances.
What is the difference between fair value gaps and regular gaps?
FVGs occur during continuous price action without actual price jumps, characterised by non-overlapping ranges between candles. Regular gaps arise from price jumps between candles – often after market closures or major news – and indicate abrupt shifts in sentiment or liquidity.
Can you automate a fair value gap strategy?
Yes. Platforms such as MetaTrader 4 allow automation through Expert Advisors. Define clear conditions based on FVGs and confirming indicators, create or adapt scripts in MQL4, and backtest thoroughly before live deployment.