Capital Com SV Investments Limited:
CFD-urile sunt instrumente complexe și au un risc ridicat de a pierde rapid bani din cauza efectului de levier. 73% din conturile investitorilor de retail pierd bani atunci când tranzacționează CFD-uri cu acest furnizor. Ar trebui să luați în considerare dacă înțelegeți modul în care funcționează CFDurile și dacă vă puteți permite să vă asumați riscul ridicat de a vă pierde banii. Consultați Declarația noastră deinformare privind riscurile
Capital Com Group Ltd:
CFD-urile sunt instrumente complexe și prezintă un risc ridicat de a pierde rapid bani din cauza efectului de levier. Între 74 și 89% din conturile investitorilor de retail pierd bani atunci când tranzacționează CFD-uri. Ar trebui să vă gândiți dacă înțelegeți cum funcționează CFD-urile și dacă vă puteți permite să vă asumați riscul ridicat de a vă pierde banii. Consultați Declarația noastră deinformare privind riscurile
Avertisment privind riscurile: Valoarea acțiunilor și a ETF-urilor cumpărate prin intermediul unui cont de tranzacționare cu acțiuni poate crește sau scădea, ceea ce înseamnă că s-ar putea să recuperați mai puțin decât ați investit inițial. Performanțele anterioare nu garantează rezultatele viitoare.
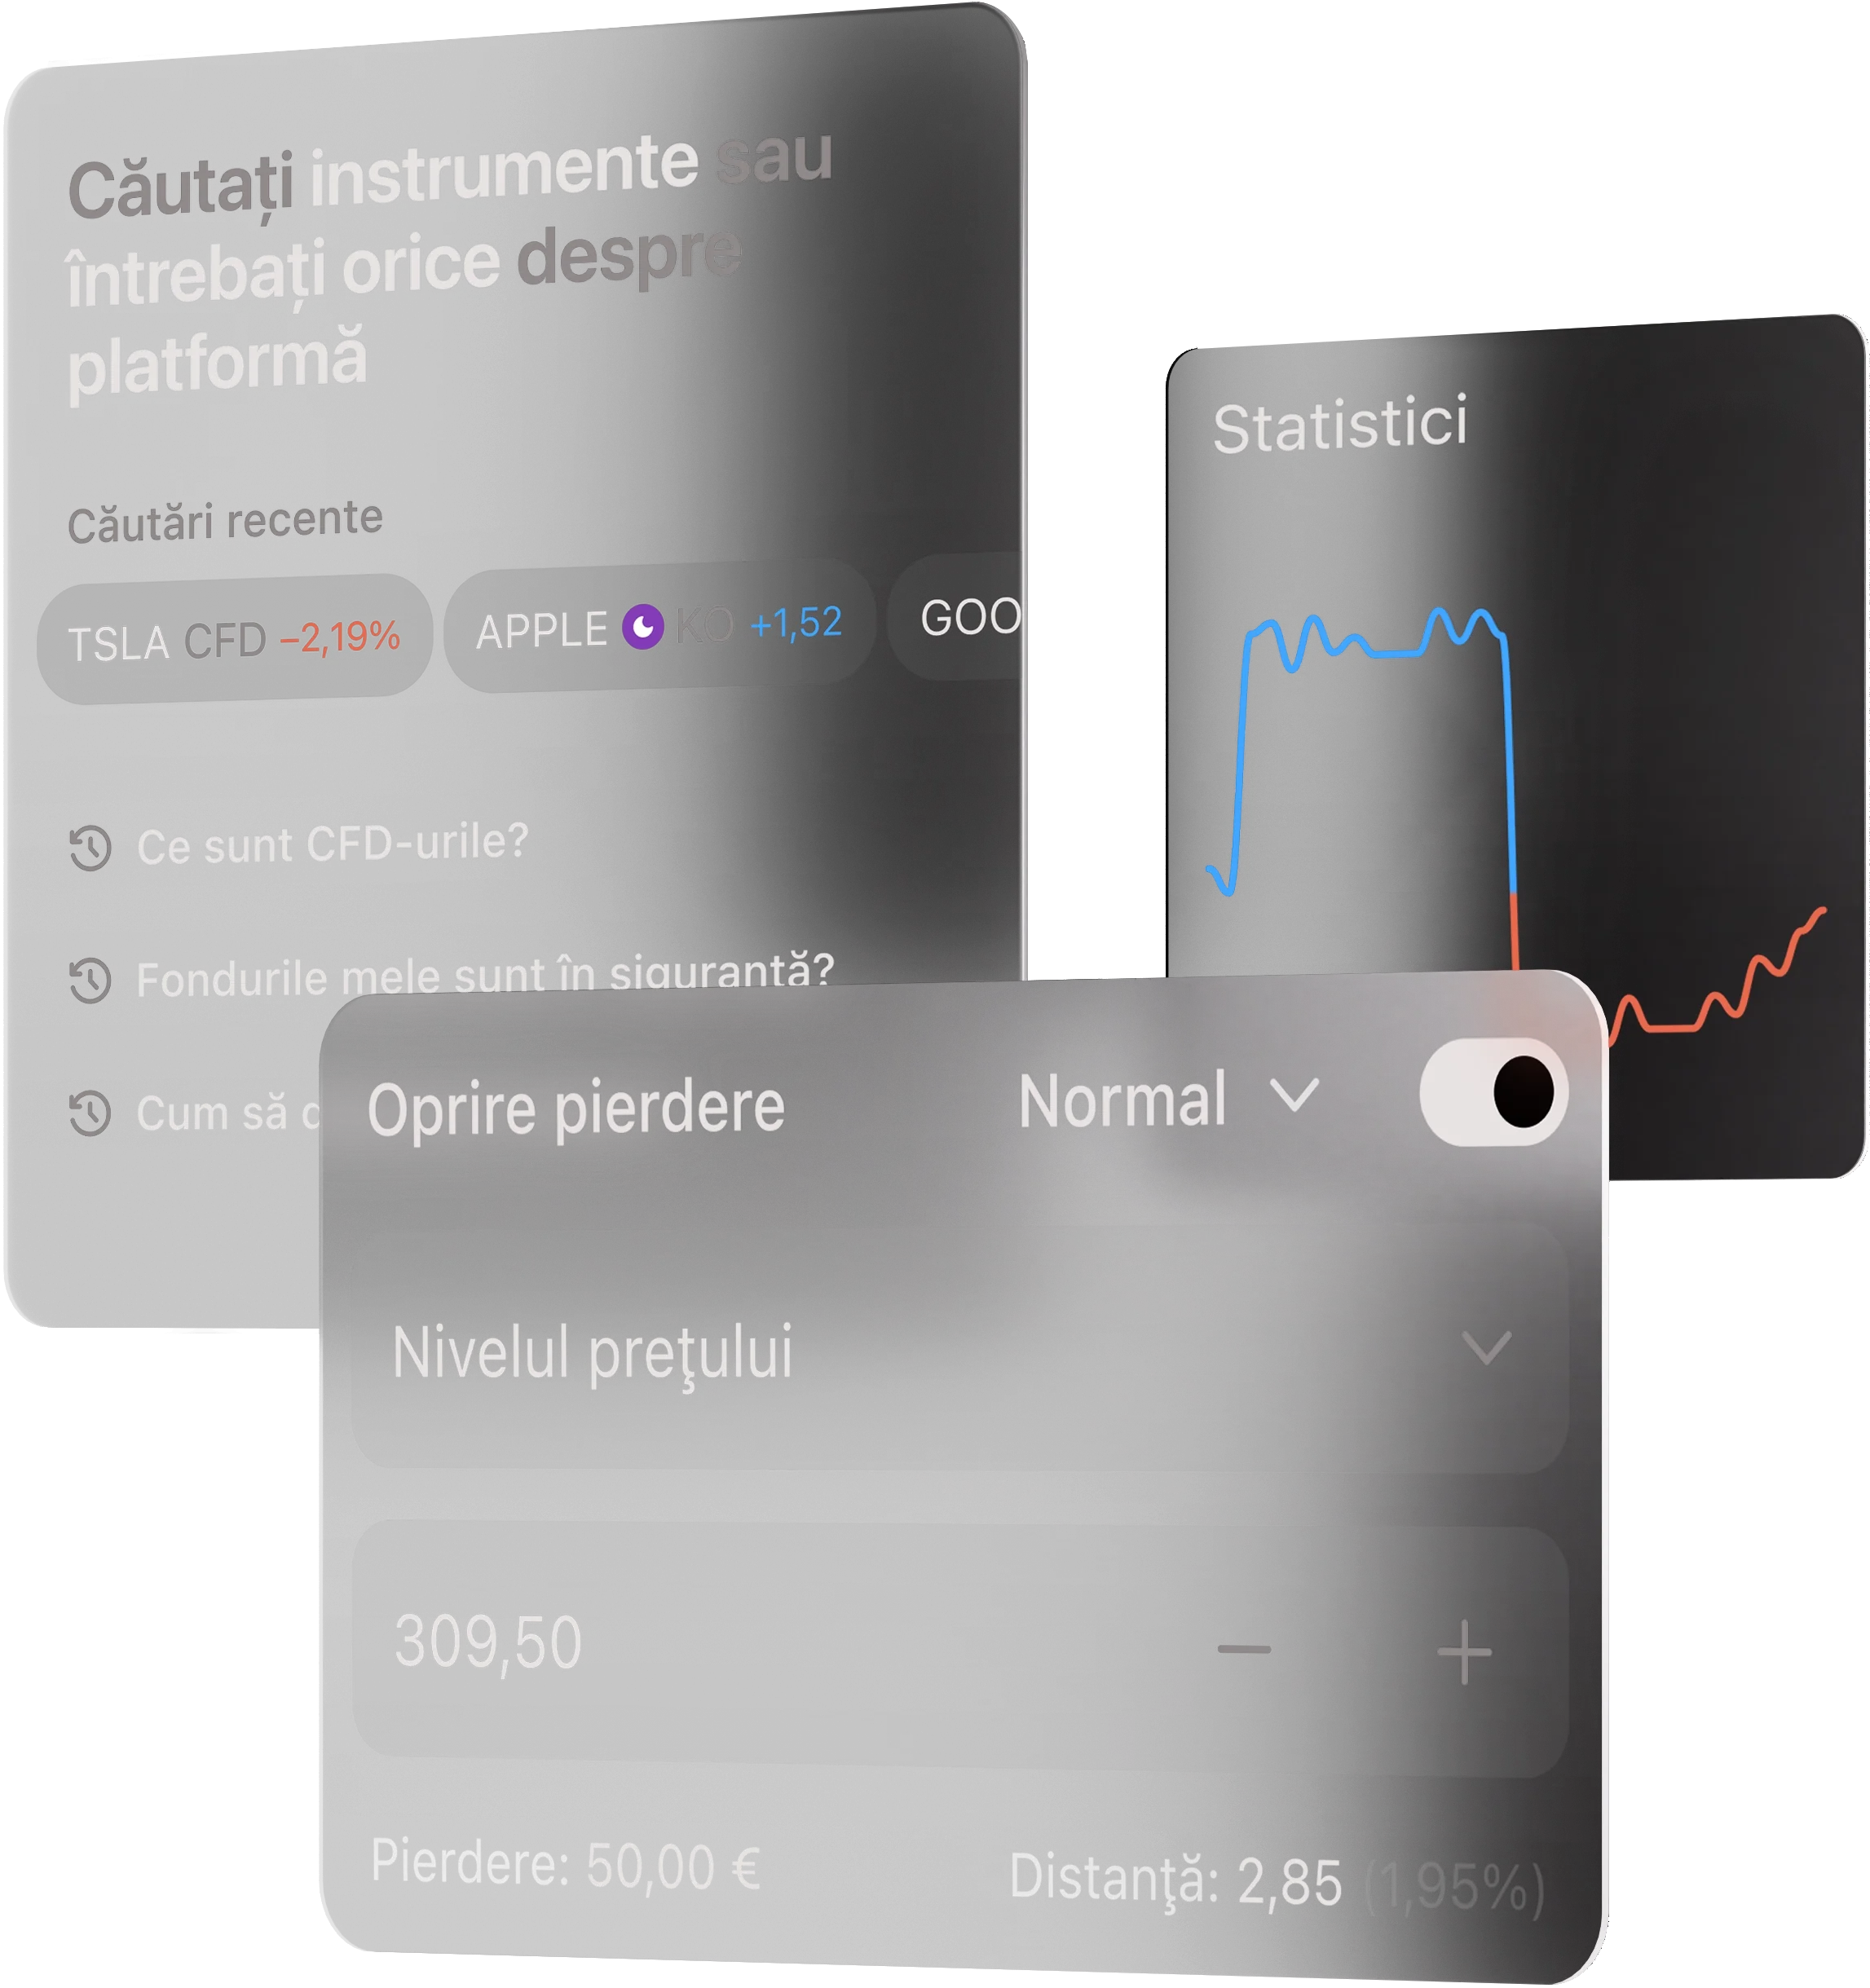
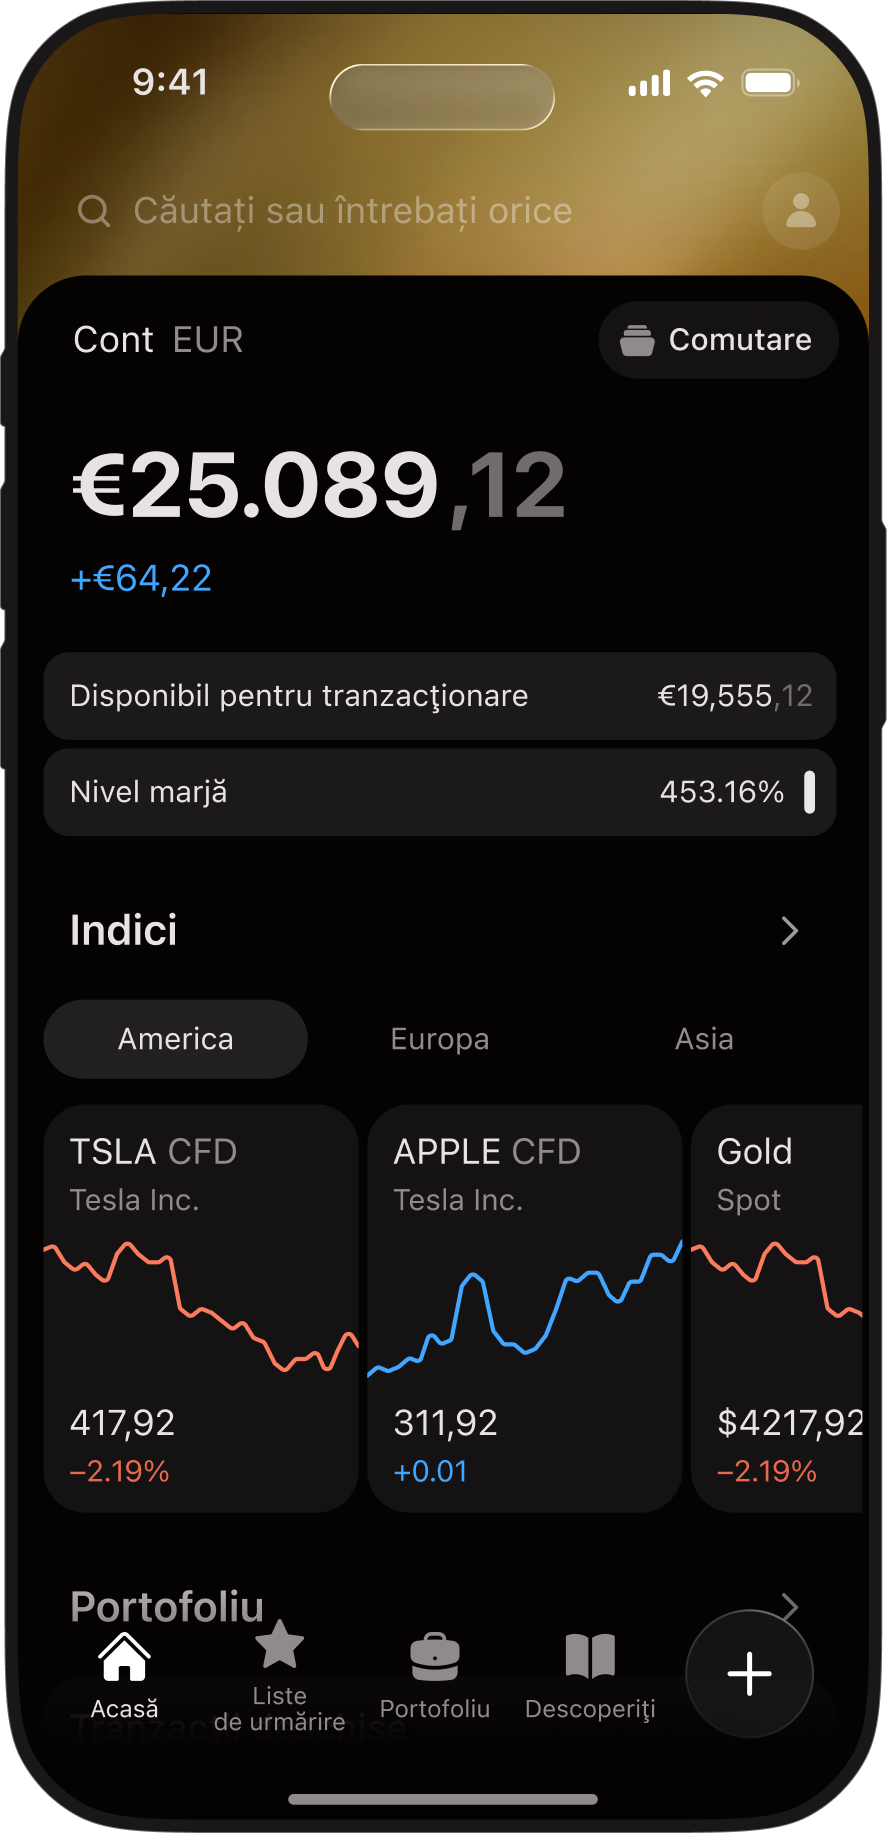
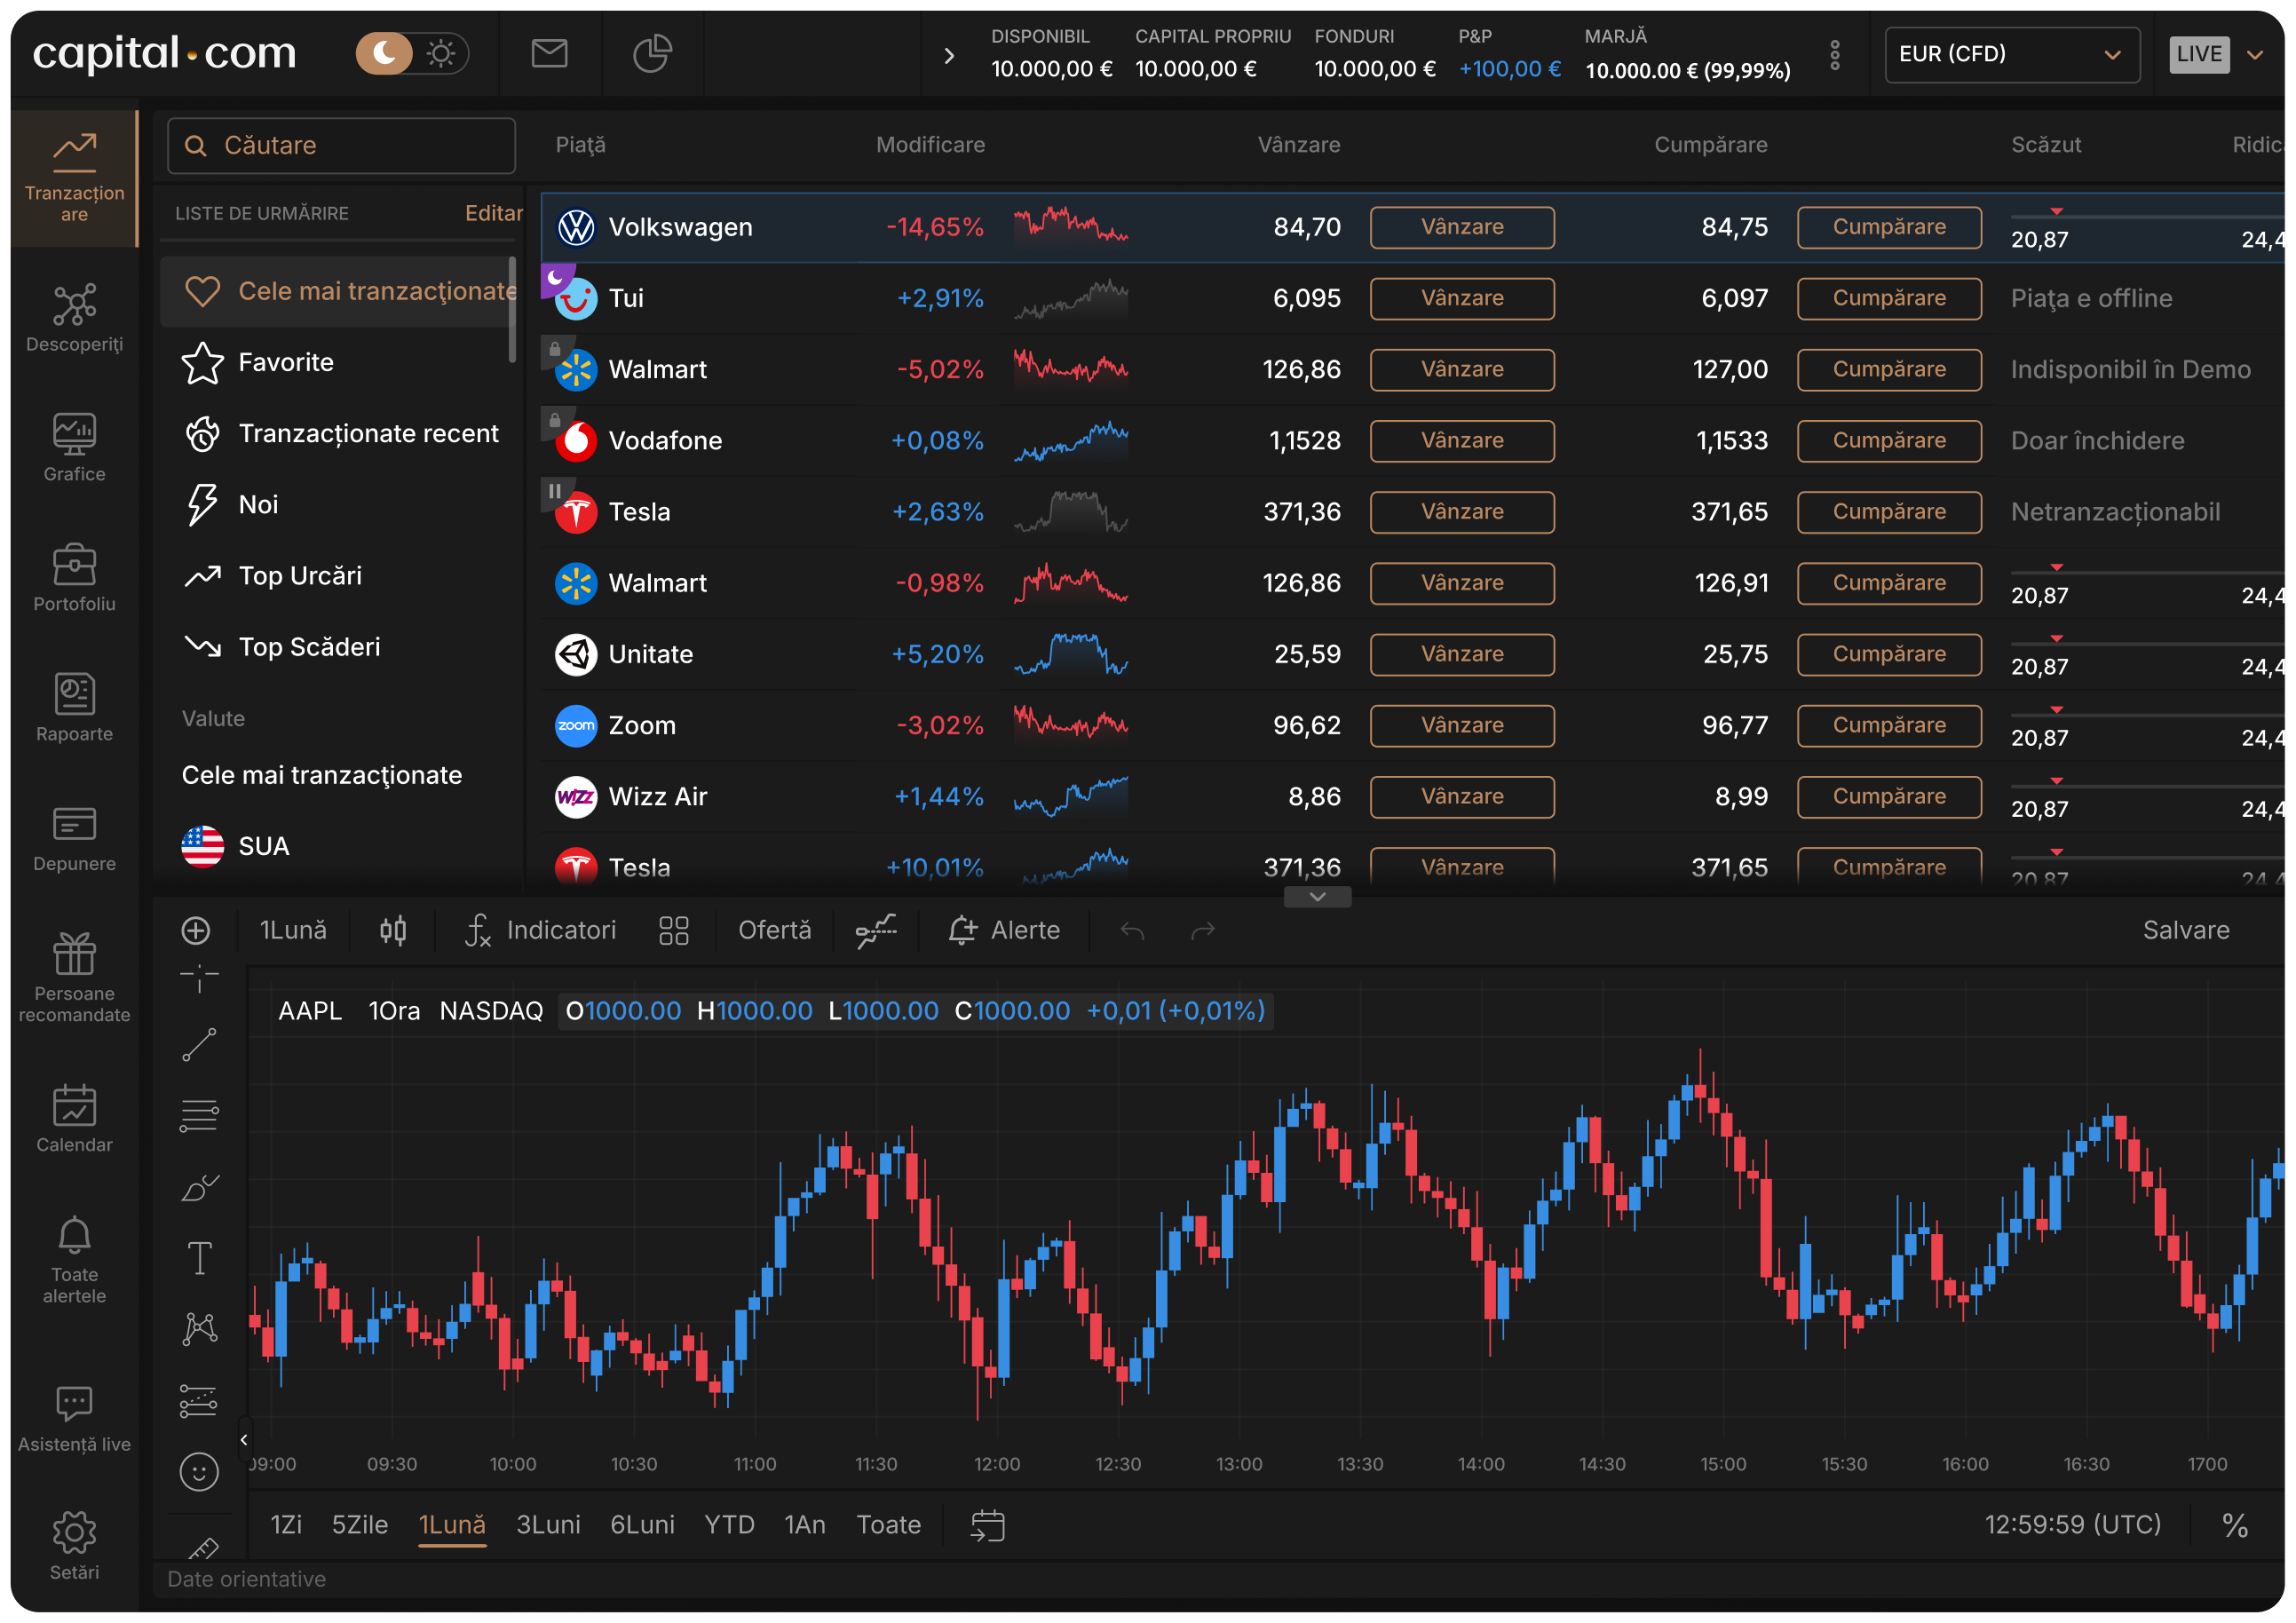
Tranzacțiile cu instrumente extrabursiere nelivrabile, precum opțiunile knock-out și CFD-urile, sunt produse financiare complexe care prezintă un risc ridicat de pierdere a întregului capital investit. Astfel de produse nu sunt potrivite pentru toți investitorii, deoarece pot genera atât câștiguri, cât și pierderi semnificative. Înainte de a vă angaja în acest tip de tranzacționare, ar trebui să analizați cu atenție dacă înțelegeți modul în care funcționează aceste instrumente și dacă vă puteți permite să vă asumați riscul ridicat de a vă pierde banii.
Pentru clienții profesioniști, există riscul de a pierde mai mult decât depozitul inițial. Informațiile de pe acest site web sunt de natură generală și nu iau în considerare situația financiară, obiectivele sau nevoile dumneavoastră. Consultați documentele noastre legale și asigurați-vă că înțelegeți pe deplin riscurile înainte de a lua orice decizie de tranzacționare. Vă încurajăm să utilizați serviciile de instruire ale companiei noastre pentru a înțelege mai bine riscurile înainte de a vă angaja în operațiuni de tranzacționare.
Capital Com SV Investments Limited este o societate constituită în Republica Cipru cu numărul de înregistrare HE 354252 și este autorizată și reglementată de Comisia pentru valori mobiliare și burse din Cipru (numărul de licență 319/17). Sediul social: Str: Vasileiou Makedonos 8, Kinnis Business Center, 2nd floor, 3040, Limassol, Cipru.
Capital Com Group Ltd este o societate constituită în Republica Cipru cu numărul de înregistrare ΗΕ 446198 și este autorizată și reglementată de Comisia pentru valori mobiliare și burse din Cipru (numărul de licență 463/25). Sediul social: Str: Vasileiou Makedonos 8, Kinnis Business Center, 2nd floor, 3040, Limassol, Cipru.
Informațiile de pe acest site nu se adresează rezidenților din Statele Unite, Canada și Belgia sau oricărei alte țări din afara SEE și nu sunt destinate distribuirii către sau utilizării de către orice persoană din orice țară sau jurisdicție în care o astfel de distribuire sau utilizare ar fi contrară legislației sau reglementărilor locale.