Xiaomi stock forecast: Stellantis talks, earnings ahead
Xiaomi is a Hong Kong-listed technology company whose shares remain in focus ahead of full-year 2025 earnings and after reported discussions with Stellantis on potential European investment options. Past performance is not a reliable indicator of future results. Explore third-party price targets.
Xiaomi Corporation (1810) is trading at $35.20 HKD as of 3:52pm UTC on 16 March 2026, within an intraday range of $33.12-$35.24 HKD on Capital.com's feed. Past performance is not a reliable indicator of future results.
Price action comes as investors weigh several concurrent developments. Bloomberg reported on 12 March 2026 that Stellantis executives had held discussions with Xiaomi on potential European investment options, including possible stakes in Maserati or other Stellantis brands (Bloomberg, 12 March 2026). Xiaomi's full-year 2025 earnings are scheduled for release on 24 March 2026, with consensus estimates compiled by Bloomberg indicating that net income may have declined year on year (The Globe and Mail, 25 February 2026). The broader Hong Kong market also provided a supportive backdrop, with the HK50 index gaining approximately 1.3% in the 16 March session to around 25,799 points (Trading Economics, 16 March 2026). Short-selling activity has also been elevated, with Xiaomi shares having declined roughly 44% from their 12-month peak prior to today's recovery (Yahoo Finance, 13 March 2026).
Xiaomi stock forecast 2026–2030: Third-party price targets
As of 16 March 2026, third-party Xiaomi stock predictions span a wide range, shaped by diverging assumptions on EV delivery volumes, smartphone margin pressure, upstream cost inflation, and the pace of the withdrawal of China consumer subsidies. The following targets summarise broker views and consensus projections published between 28 February and 16 March 2026.
Nomura (target price cut)
Nomura maintains a Neutral rating on Xiaomi, cutting its 12-month 1810 stock forecast from $61 HKD to $33 HKD. The broker forecasts that smartphone shipments could decline by approximately 20% year on year amid rising bill-of-materials costs, and flags that high market expectations for the EV business may not be met if demand and profitability remain weaker than anticipated (AAStocks, 3 March 2026).
J.P. Morgan (Neutral rating)
J.P. Morgan holds a Neutral rating on Xiaomi with a 12-month price target of $38 HKD, as captured in the current broker ratings table. The bank's cautious stance reflects lower core earnings projections for 2026 and 2027, trimmed EV margin assumptions, and a more moderate recovery trajectory for the smartphone segment (AAStocks, 16 March 2026).
Goldman Sachs (target price revision)
Goldman Sachs maintains a Buy rating on 1810, lowering its 12-month price target from $47.50 HKD to $41 HKD. The bank cites rising upstream costs in consumer electronics and automotive supply chains, the gradual phasing out of national EV subsidies, and resulting pressure on gross margins across the smartphone, AIoT, and smart EV divisions as the basis for the cut (Futu News, 10 March 2026).
Yahoo Finance / Simply Wall St (valuation scenario analysis)
Yahoo Finance's analyst-sourced scenario analysis for 1810 places a bull-case fair value at $51.83 HKD and a bear-case fair value at $31.23 HKD, based on revenue growth assumptions of 15% and 13.67% respectively. The bull case centres on Xiaomi's high-specification smartphone positioning and IoT ecosystem stickiness, while the bear case flags smartphone market saturation, rising R&D expenditure, and dependence on low-margin hardware as the primary downside factors (Yahoo Finance, 1 March 2026).
Deutsche Bank (Outperform, highest published target)
Deutsche Bank maintains an Outperform rating on 1810 with a 12-month price target of $71 HKD, the highest among brokers in the current ratings table. The bank's constructive view reflects confidence in Xiaomi's diversified hardware and EV ecosystem expansion over the medium term, set against a backdrop of near-term competitive pricing pressure and elevated upstream cost headwinds (AAStocks, 16 March 2026).
Predictions and third-party forecasts are inherently uncertain, as they cannot fully account for unexpected market developments. Past performance is not a reliable indicator of future results.
1810 stock price: Technical overview
The 1810 stock price trades at $35.20 HKD as of 3:52pm UTC on 16 March 2026, sitting just above the pivot point at $35.24 HKD and within a mixed moving-average structure. The 20/50/100/200-day SMAs stand at approximately $34 / $36 / $39 / $47, with price currently below the 50-day SMA at $35.78 HKD and well below the 100 and 200-day equivalents. This suggests that the short-term averages have turned constructive while the medium-to-long-term trend remains under pressure. The 20-day SMA at $34.41 HKD sits below the current price, providing a near-term floor, but the 20-under-50 configuration reflects the broader corrective phase still in force.
Momentum is tentatively improving: the 14-day RSI reads 53.71, placing it in upper-neutral territory, consistent with a consolidation phase rather than a directional trend. The ADX at 17.54 is below the 25 threshold, signalling a weak and non-trending environment where range-bound conditions may persist.
On the topside, the classic R1 at $37.16 HKD is the first pivot reference to watch. A convincing daily close above that level would put R2 near $39.42 HKD in view. Beyond there, the 100-day SMA at $38.94 HKD represents a meaningful overhead shelf that would need to be cleared on a sustained basis before any recovery towards the $40 area gains traction.
On pullbacks, the pivot point at $35.24 HKD and the 20-day SMA near $34.41 HKD form the first support band. A daily close below these levels would put the classic S1 at $32.98 HKD in focus, with the S2 reference near $31.06 HKD as the next meaningful downside marker if selling pressure extends (TradingView, 16 March 2026).
This is technical analysis for informational purposes only and does not constitute financial advice or a recommendation to buy or sell any instrument.
Xiaomi share price history (2024–2026)
1810’s stock price closed at $14.99 HKD on 18 March 2024, near the base of a multi-month consolidation range on the Hong Kong Stock Exchange.
From that level, shares climbed steadily through the second half of 2024, closing the year at $34.69 HKD on 31 December 2024 - a gain of approximately 131% over the period - as investor appetite for China technology names recovered alongside improving consumer sentiment and early excitement around the company's EV ambitions. The rally extended into 2025, with 1810 reaching a closing high of $59.46 HKD on 25 September 2025, before a sharp reversal pulled the stock back. It dropped as low as $36.14 HKD on 7 April 2025 amid broader Hong Kong market volatility before rebounding through the summer.
A second leg higher carried 1810 to that September peak, but selling pressure returned through the final quarter of 2025 and into 2026. The stock opened 2026 at $40.21 HKD, drifted lower through February and into early March, and touched a recent closing low of $31.66 HKD on 3 March 2026.
1810 closed at $35.24 HKD on 16 March 2026, approximately 12.4% down year to date but 1.6% up year on year, and around 40.7% below the September 2025 peak.
Past performance is not a reliable indicator of future results. Share prices are indicative and may differ from live market prices.
Xiaomi (1810): Capital.com analyst view
Xiaomi's (1810) share price trajectory over the past two years reflects the company's ongoing transformation from a smartphone-focused hardware maker into a broader technology and electric vehicle platform. The stock's climb from around $15 HKD in early 2024 to a peak near $59.46 HKD in September 2025 was largely driven by investor enthusiasm around EV delivery growth, AIoT ecosystem expansion, and improving sentiment towards China technology stocks. However, that same narrative carries execution risk: EV margin pressure, rising upstream costs, and the gradual withdrawal of national consumer subsidies have all contributed to the subsequent pullback to current levels around $35.20 HKD.
Looking at the broader picture, Xiaomi's diversified revenue base - spanning smartphones, smart home devices, and now EVs - offers some resilience against weakness in any single segment, though it also means the share price is exposed to a wide range of macro and sector-specific headwinds at the same time. Competitive pricing pressure in both the smartphone and EV markets could weigh on margins, while any acceleration in EV adoption or positive earnings surprises could support a recovery in sentiment.
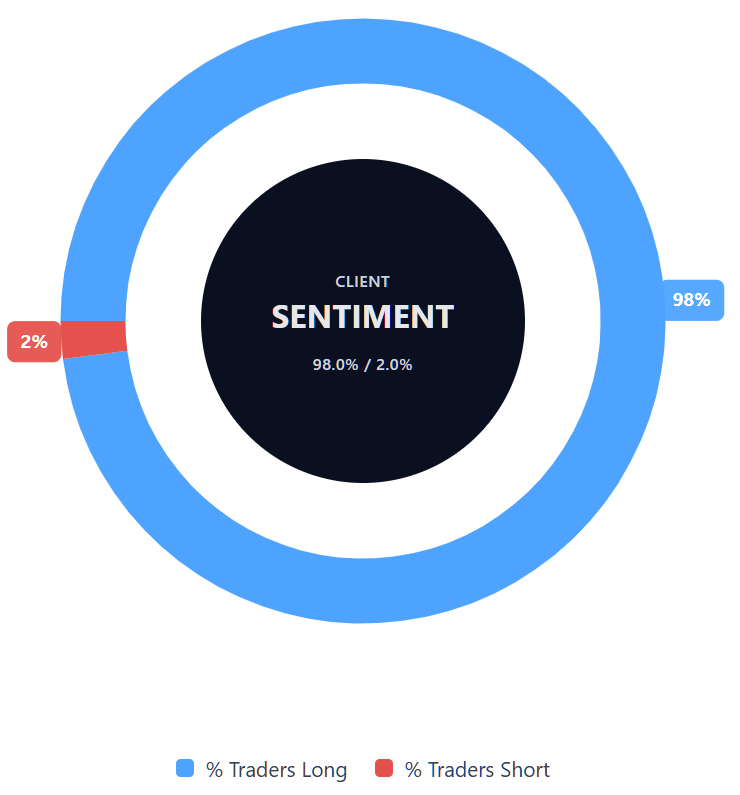
Capital.com’s client sentiment for Xiaomi CFDs
As of 16 March 2026, Capital.com client positioning in Xiaomi CFDs is skewed towards buyers: 98% long vs 2% short, putting buyers ahead by 96 pp and placing sentiment firmly in one-sided territory in favour of longs. This snapshot reflects open positions on Capital.com and can change.
Summary – Xiaomi 2026
- Xiaomi (1810) trades at $35.20 HKD as of 3:52pm UTC on 16 March 2026, around 12.4% down year to date and roughly 40.7% below the September 2025 peak of $59.46 HKD.
- Price has recovered from a recent closing low of $31.66 HKD on 3 March 2026, with the intraday range on 16 March spanning $33.12-$35.24 HKD.
- Short-term moving averages (10/20-day SMAs near $33-$34 HKD) signal a buy, while the 50/100/200-day SMAs above the current price signal a sell view, reflecting a mixed medium-to-long-term trend.
- The 14-day RSI sits at 53.71 (upper-neutral), and the ADX at 17.54 indicates a weak, non-trending environment; momentum indicators lean mildly constructive.
- Key price drivers include China consumer sentiment, EV margin execution, smartphone gross profit recovery, upstream cost inflation, and the phased withdrawal of national EV subsidies.
Past performance is not a reliable indicator of future results.
FAQ
Who owns the most Xiaomi stock?
What is the 5 year Xiaomi share price forecast?
Is Xiaomi a good stock to buy?
Could Xiaomi stock go up or down?
Should I invest in Xiaomi stock?
Can I trade Xiaomi CFDs on Capital.com?
Yes, you can trade Xiaomi CFDs on Capital.com. Trading share CFDs lets you speculate on price movements without owning the underlying asset and to take long or short positions. However, contracts for difference (CFDs) are traded on margin, and leverage amplifies both profits and losses. You should ensure you understand how CFD trading works, assess your risk tolerance, and recognise that losses can occur quickly.