US Tech 100 forecast: Middle East tensions, futures lower
The US Tech 100 (Nasdaq 100 index) – which tracks leading non-financial companies on the Nasdaq – has edged lower as US index futures fell over 1% amid Middle East tensions and continued scrutiny of major AI-focused stocks. Past performance is not a reliable indicator of future results.
The Nasdaq 100 index – called the US Tech 100 (US100) on CFD trading platforms such as Capital.com – is trading around 24,581.9 in Monday’s US afternoon session, having moved between 24,471.4 and 25,025.5 so far today (1:59pm UTC on 2 March 2026). Past performance is not a reliable indicator of future results.
The current pullback comes amid a more than 1% drop in US stock index futures, as markets react to escalating tensions in the Middle East and assess the potential impact on global risk appetite (Reuters, 2 March 2026). Tech-heavy benchmarks have also lagged other regions year to date, as policy uncertainty and scrutiny of large AI leaders weigh on sentiment, with US equities underperforming global peers in 2026 so far (Reuters, 27 February 2026).
US Tech 100 forecast 2026–2030: Third-party targets
As of 2 March 2026, third-party US Tech 100 predictions highlight a wide range of potential outcomes for 2026, reflecting differing assumptions about earnings growth, interest rates and positioning across US large-cap technology names. As with all third-party forecasts, these projections are inherently uncertain and do not constitute financial advice.
Investing.com (technical roadmap)
Investing.com outlines a medium-term Elliott Wave roadmap in which the Nasdaq 100 could extend towards about 26,608 under a seasonal March peak scenario, with a nearer technical waypoint around 24,200. The analysis cites prior rally extensions, Fibonacci projections and recent sideways consolidation as factors that could allow for further gains within established seasonal patterns (Investing.com, 11 February 2026).
DailyForex (March trading range view)
DailyForex notes that the Nasdaq 100 has been consolidating after a strong prior year and suggests March could see a positive bias, provided buyers continue to support the index on pullbacks. The analysis focuses on whether prices can challenge the 26,250 area. It frames this scenario within a broader consolidation phase shaped by tariff uncertainty, earnings headlines and questions about how external risks may affect overall risk appetite (DailyForex, 2 March 2026).
Motley Fool (relative return expectations)
A column syndicated on Yahoo Finance reports that Motley Fool analysts expect the Dow Jones Industrial Average to outperform Nasdaq benchmarks in 2026 after several years of technology-led gains. This view implies comparatively modest relative return expectations for Nasdaq-linked indices such as the Nasdaq 100. The piece refers to valuation gaps, elevated price-to-earnings ratios in parts of the technology sector, and the possibility that cyclical and non-tech sectors could lead if AI-linked earnings fall short of expectations (Yahoo Finance, 13 January 2026).
MarketBeat (index-linked valuation signals)
A MarketBeat screen of Nasdaq-100-related value ideas highlights that some of the index’s constituent stocks show consensus 12-month price targets implying double-digit upside from late-February levels. One referenced stock shows an average target of $19.20 versus a spot price near $6. The note suggests that such gaps may reflect a combination of cautious analyst assumptions and ongoing risk aversion towards certain technology names, even as the broader index absorbs prior gains amid valuation and policy debates (MarketBeat, 23 February 2026).
Predictions and third-party forecasts are inherently uncertain, as they cannot fully account for unexpected market developments. Past performance is not a reliable indicator of future results.
US100 index price: Technical overview
On the daily chart, the US100 index trades just below its short- and medium-term moving-average band. The 20-, 50-, 100- and 200-day moving averages cluster around 25,029, 25,311, 25,260 and 24,106 respectively, while price trades near 24,581.9 as of 1:59pm UTC on 2 March 2026.
The 14-day relative strength index (RSI) at 47.2 sits in mid-neutral territory, and the average directional index (ADX) near 18.0 indicates relatively weak trend strength. Together, these readings are consistent with a market that is oscillating around key reference levels rather than developing a strong directional trend.
On the upside, the nearest classic resistance level stands around 26,160. A sustained daily close above this area would place 26,768 in focus as the next resistance zone. On pullbacks, the classic pivot at 25,557 acts as an initial reference point. The longer-term 200-day simple moving average near 24,106 remains a notable technical level, with S1 at 24,949 marking an additional downside reference if prices close decisively below nearby support (TradingView, 2 March 2026).
This technical analysis is provided for informational purposes only and does not constitute financial advice or a recommendation to buy or sell any instrument.
US Tech 100 index history (2024–2026)
The US Tech 100 index recorded a sustained advance over the past two years, rising from around 18,031 at the start of March 2024 to approximately 24,579 by 2 March 2026. During this period, the index moved near 20,660 in early May 2024, approached 21,015 by late December 2024, and extended into the mid-20,000s through 2025 as several large US technology names outperformed broader benchmarks.
The path higher has not been linear. In early April 2025, the index spiked towards 23,920 before retreating to around 19,180 later that month. From roughly 20,919 in early March 2025, it then climbed towards the 25,000 area by year end. More recently, US100 has eased from late-January 2026 levels near 25,583 to just under 24,600 at the start of March 2026, leaving it well above its March 2024 level but below its 2026 highs.
Past performance is not a reliable indicator of future results. Share prices are indicative and may differ from live market prices.
US Tech 100 (US100): Capital.com analyst view
Over the past two years, US Tech 100 (US100) has moved from the high-18,000s in early 2024 to the mid-20,000s by early 2026, supported in part by performance in large US technology and growth stocks. Strong earnings narratives and sustained interest in themes such as artificial intelligence and cloud computing have featured prominently during this period. However, the index’s concentration in a relatively small group of mega-cap companies means it may also react sharply if sentiment towards high-growth technology shifts or if valuations face pressure in a weaker macroeconomic environment.
In the shorter term, recent trading between approximately 24,500 and 25,500 reflects a market that remains elevated relative to mid-2025 levels, yet continues to experience periodic volatility.
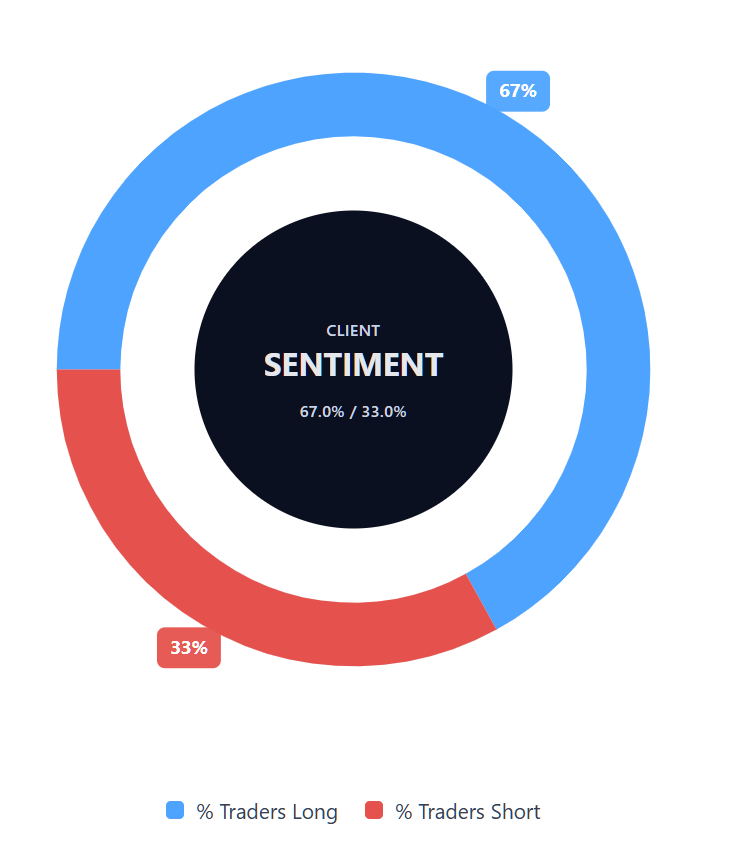
Capital.com’s client sentiment for US Tech 100 CFDs
As of 2 March 2026, Capital.com client positioning in US Tech 100 CFDs
Summary – US Tech 100 2026
- As of early March 2026, US Tech 100 (US100) trades near 24,580, up from around 18,000 in March 2024, but below the mid-20,000s peaks recorded earlier in 2026.
- Daily technical indicators show price moving around key moving averages, with a mid-neutral RSI and relatively weak trend strength, consistent with consolidation rather than a pronounced directional move.
- Key drivers include shifts in sentiment towards large US technology and AI-linked stocks, evolving expectations for US interest rates, and broader changes in global equity risk appetite.
- Recent news flow has highlighted volatility around earnings in major technology names, valuation debates, and geopolitical developments such as tensions in the Middle East, all of which have influenced US index futures and broader market positioning.
Past performance is not a reliable indicator of future results.
FAQ
Who owns the most US Tech 100?
The US Tech 100 tracks the performance of the Nasdaq 100 index, which is made up of 100 large non-financial companies listed on the Nasdaq exchange. No single individual or entity 'owns' the index itself. Ownership instead relates to the underlying companies, whose largest shareholders typically include institutional investors such as asset managers, pension funds and exchange-traded funds (ETFs) that track the index.
What is the 5 year US Tech 100 forecast?
There is no single agreed five-year US100 index forecast. Long-term projections vary widely and depend on assumptions about earnings growth, interest rates, technological innovation and global economic conditions. While some analysts publish multi-year targets, such forecasts are inherently uncertain and can change quickly as new data emerges. Traders should treat long-term projections as scenarios rather than predictions of future performance.
Is US Tech 100 a good CFD to trade?
Whether US Tech 100 is suitable as a CFD depends on your objectives, risk tolerance and trading approach. The index often attracts traders due to its liquidity and exposure to major US technology companies. However, CFDs are leveraged products, which means gains and losses can be magnified. Volatility in large-cap technology stocks can create trading opportunities, but it also increases risk, particularly during earnings seasons or macroeconomic shifts.
Could US Tech 100 go up or down?
Like any equity index, US Tech 100 can move in either direction. Its price reflects a combination of company earnings, interest rate expectations, investor sentiment and global events. Concentration in large technology names means the index can react sharply to sector-specific news, regulatory developments or changes in risk appetite. Both upward and downward movements are possible, sometimes within short timeframes, especially during periods of heightened volatility.
Should I invest in US Tech 100?
Whether to invest or trade US Tech 100 is a personal decision that should take into account your financial situation, objectives and risk tolerance. The index provides exposure to leading US technology companies, but it can experience significant price swings. This information is not investment advice. You may wish to conduct your own research or seek independent financial advice before making any investment decision.
Can I trade US Tech 100 CFDs on Capital.com?
Yes, you can trade US Tech 100 CFDs on Capital.com. Trading index CFDs lets you speculate on price movements without owning the underlying asset and to take long or short positions. However, contracts for difference (CFDs) are traded on margin, and leverage amplifies both profits and losses. You should ensure you understand how CFD trading works, assess your risk tolerance, and recognise that losses can occur quickly.