Tesla stock forecast: FSD filing before NHTSA
Tesla is a US-listed electric vehicle and technology company, with current focus on Full Self-Driving filings, Cybercab production plans and the wider commercial outlook for autonomy. Past performance is not a reliable indicator of future results. Explore third-party TSLA price targets.
Tesla, Inc. (TSLA) is trading at $399.29 as of 3:20pm UTC on 16 March 2026, within an intraday range of $390.01–$401.89; the stock is holding above the closely watched $390 support level that has acted as a key threshold through the month, and has pulled back from the $407.82 session close recorded on 12 March 2026.
The pullback comes amid a broader softening in US equities, with the S&P 500 closing at 6,632.19 on 13 March 2026 and trading near its 200-day moving average and down approximately 1.86% year to date (Investing.com, 16 March 2026), while the Nasdaq has faced three consecutive weeks of losses amid elevated macro uncertainty (The Wall Street Journal, 13 March 2026). Tesla filed Full Self-Driving data with the National Highway Traffic Safety Administration (NHTSA) ahead of the 9 March 2026 regulatory deadline (AInvest, 10 March 2026).
Tesla stock forecast 2026–2030: Third-party price targets
As of 16 March 2026, third-party Tesla stock predictions span from $280 to $600, reflecting deeply divergent views on near-term margin risk, robotaxi execution, and the commercial timeline for Full Self-Driving (FSD). The five briefs below cover that range, ordered from most bearish to most bullish.
BNP Paribas Exane (underperform cut)
BNP Paribas Exane trims its 12-month TSLA stock forecast to $280, down from $313, while retaining an Underperform rating. The firm flags a projected $4 billion free- cash-flow shortfall versus consensus for 2026, citing margin compression and AI/software execution risk as the primary headwinds (MarketScreener, 3 March 2026).
MarketBeat (Wall Street consensus)
MarketBeat aggregates 41 analyst ratings into a consensus average 12-month price target of $406.84, with individual estimates ranging from $19.05 to $600; the consensus rating is Hold, drawn from 9 Sell, 13 Hold, and 19 Buy recommendations (MarketBeat, 14 March 2026).
Bank of America (buy reinstatement)
Bank of America reinstates coverage on TSLA with a Buy rating and a $460 price target. Analyst Alexander Perry frames Tesla as the leading consumer autonomy platform, estimating that robotaxi services represent approximately 52% of the company's overall valuation, with robotaxi expansion into seven additional US metropolitan areas expected in the first half of 2026 (Yahoo Finance, 4 March 2026).
Wedbush (outperform reiteration)
Wedbush reiterates its Outperform rating and a Street-high $600 price objective on TSLA, as confirmed in the MarketBeat analyst round-up. Analyst Dan Ives assigns a minimum $1 trillion valuation to Tesla's AI and autonomy platform alone, citing regulatory tailwinds and an accelerating FSD adoption curve as the principal drivers (MarketBeat, 4 March 2026).
Predictions and third-party forecasts are inherently uncertain, as they cannot fully account for unexpected market developments. Past performance is not a reliable indicator of future results.
TSLA stock price: Technical overview
On the daily chart, the TSLA stock price trades at $399.29 as of 3:20pm UTC on 16 March 2026, sitting just beneath a dense moving-average shelf where the 20/50/100-day SMAs stack between roughly $404 and $432, all of which read as sell signals against the current price. The 200-day SMA near $394 and the 200-day EMA near $396 provide the nearest support below, with price currently sandwiched in a narrow band between those long-term anchors and the heavier resistance cluster above.
Momentum is mixed and soft: the 14-day RSI at 45.77 sits in neutral territory, consistent with an absence of directional conviction, while the ADX at 24.59 approaches the 25 threshold that would suggest an established trend. The MACD level at -6.56 and momentum (10) at -2.92 both carry buy signals, suggesting early stabilisation after recent selling pressure, though neither reading is strong enough to indicate a clear reversal.
On the topside, the classic R1 pivot at $430.06 is the first meaningful level to reclaim; a convincing daily close above that level would bring the R2 zone near $457.62 into view. The 100-day SMA at $432.38 sits close to R1 and reinforces that area as a compound resistance band, meaning the $430-$432 zone is likely to require sustained buying interest to clear.
On pullbacks, the classic pivot at $408.80 acts as initial reference support, followed by the 200-day EMA near $395.90 and the 200-day SMA near $393.67, which together form the long-term MA shelf in the $394-$396 area. A daily close below that shelf could open the way to S1 near $381.24, which aligns broadly with the lower Fibonacci retracement band (TradingView, 16 March 2026).
This is technical analysis for informational purposes only and does not constitute financial advice or a recommendation to buy or sell any instrument.
Tesla share price history (2024–2026)
TSLA’s stock price has had a turbulent two years, swinging from multi-year lows to record highs and back again, all within the space of roughly 24 months.
The stock closed at $173.74 in mid-March 2024, in the middle of a prolonged slump driven by slowing EV demand growth, price cuts squeezing margins, and a broader rotation away from high-growth names. That weakness persisted into early 2025, with TSLA bottoming around $215.30 on 10 March 2025 before briefly recovering, then selling off sharply again through April, touching a two-year low close of $227.91 on 22 April 2025 amid a wider market drawdown and concerns over Tesla's first-quarter delivery miss.
The recovery from that trough was strong. TSLA rallied through the second half of 2025, fuelled by improving delivery data, renewed enthusiasm around Full Self-Driving and robotaxi timelines, and a broadly risk-on equity environment. The stock reached an intraday peak of $498.88 on 22 December 2025, its highest level in the dataset, before fading into the year-end close of $450.09 on 31 December 2025.
TSLA opened 2026 near $439.70 on 2 January but has since pulled back, with the stock trading at $399.71 on 16 March 2026, approximately 9.1% down year to date, though still around 75.3% higher than this time last year.
Past performance is not a reliable indicator of future results. Share prices are indicative and may differ from live market prices.
Tesla (TSLA): Capital.com analyst view
Tesla's price performance over the past two years reflects the stock's capacity for dramatic swings in either direction. After bottoming near $215 in March 2025 and sliding to a two-year low close of $227.91 in late April 2025, TSLA staged a strong recovery through the second half of 2025, reaching intraday highs above $490 in December. That move was underpinned by improving delivery momentum, growing investor confidence in Tesla's autonomy roadmap, and a broadly supportive risk environment. However, the subsequent pullback to around $399 heading into mid-March 2026 illustrates that those same catalysts carry meaningful execution risk. Delayed robotaxi rollouts, margin pressure from sustained price competition, or a shift in macro sentiment could each weigh on the stock.
Looking at the current landscape, Tesla sits at an inflection point where the bull and bear cases are unusually far apart. Bank of America's $460 target and Wedbush's $600 objective reflect the view that autonomy and AI monetisation will drive a structural re-rating; BNP Paribas Exane's $280 underperform, by contrast, underlines how much near-term free-cash-flow pressure could dampen that thesis if execution falters.
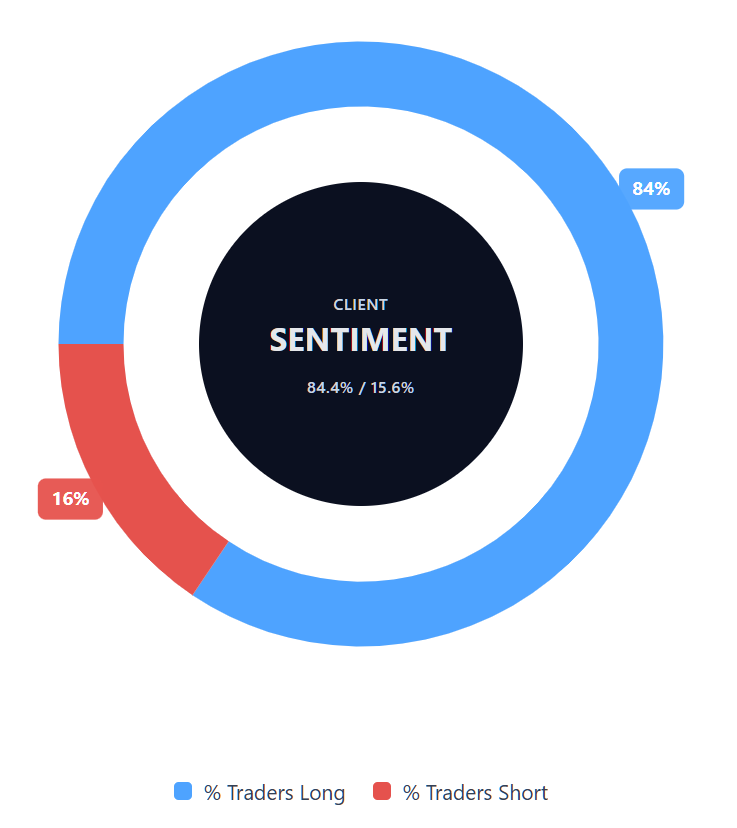
Capital.com’s client sentiment for Tesla CFDs
As of 16 March 2026, Capital.com client positioning in Tesla CFDs is skewed toward longs: 84.4% buyers against 15.6% sellers, putting buyers ahead by 68.8 pp and placing positioning firmly in heavy-buy, one-sided-toward-longs territory. This snapshot reflects open positions on Capital.com and can change.
Summary – Tesla 2026
- Tesla (TSLA) trades at $399.29 as of 3:20pm UTC on 16 March 2026, down around 9.1% year to date but roughly 75% higher year on year.
- After bottoming near $215 in March 2025, TSLA rallied to intraday highs above $490 in December 2025 before pulling back through early 2026.
- Technical indicators are mixed: the 14-day RSI sits at 45.77 (neutral), and price trades below the 20/50/100-day SMAs, with the 200-day SMA near $394 providing the nearest significant support below.
- The MACD and momentum oscillators carry early buy signals, though the ADX at 24.59 suggests trend conviction is not yet firmly established.
- Key price drivers include Tesla's robotaxi and FSD commercialisation timeline, near-term margin pressure from EV price competition, and elevated 2026 capital expenditure weighing on free cash flow.
Past performance is not a reliable indicator of future results.
FAQ
Who owns the most Tesla stock?
What is the 5 year Tesla share price forecast?
Is Tesla a good stock to buy?
Could Tesla stock go up or down?
Should I invest in Tesla stock?
Can I trade Tesla CFDs on Capital.com?
Yes, you can trade Tesla CFDs on Capital.com. Trading share CFDs lets you speculate on price movements without owning the underlying asset and to take long or short positions. However, contracts for difference (CFDs) are traded on margin, and leverage amplifies both profits and losses. You should ensure you understand how CFD trading works, assess your risk tolerance, and recognise that losses can occur quickly.