Stellantis stock forecast: Strategic reset, dividend suspension
Stellantis is a European carmaker under pressure after its February 2026 strategic reset, dividend suspension and reported talks with Xiaomi and Xpeng over potential investment. Past performance is not a reliable indicator of future results. Explore third-party STLAM price targets and technicals.
Stellantis N.V. (STLAM) is trading at €5.63 in early European trading at 11:37am UTC on 19 March 2026, within an intraday range of €5.55–€5.87. Past performance is not a reliable indicator of future results.
Sentiment around the stock remains pressured by the company’s February 2026 strategic reset, which included a €25.4 billion charge and the suspension of its 2026 dividend, as Stellantis acknowledged it had overestimated EV adoption and posted a historic annual net loss of €22.3 billion for 2025 (Yahoo Finance, 26 February 2026). A Bloomberg report from 12 March 2026 noted that Stellantis executives had held talks with Chinese EV makers Xiaomi and Xpeng over potential investments in its European operations, including possible stakes in Maserati, with no agreements finalised as of that date (Bloomberg, 12 March 2026). The broader European auto sector faces additional headwinds from a 15% US tariff on EU vehicle exports, in place since August 2025 under the EU–US trade framework, which continues to weigh on the cost outlook for European manufacturers, including Stellantis brands produced in France and Italy (Reuters, 25 September 2025).
Stellantis stock forecast 2026–2030: Third-party price targets
As of 19 March 2026, third-party Stellantis stock predictions reflect the aftermath of the group’s €22.2 billion charge and dividend suspension announced in February 2026.
MarketScreener (multi-broker consensus)
MarketScreener aggregates 27 analysts covering Milan-listed STLAM and reports a mean Outperform consensus with an average 12-month price target of €8.18, a high of €16, and a low of €5 – a spread of approximately +39% above the last close of €5.88 at the time of compilation. The wide dispersion reflects differing assumptions about the pace of restructuring execution, the group’s €1.6bn net US tariff cost for 2026, and recent credit rating downgrades by both S&P and Moody’s (MarketScreener, 17 March 2026).
Fintel (consensus tracker)
Fintel reports a revised average one-year price target for STLAM of €8.45, down 14.92% from the prior consensus of €9.93 as of 1 February 2026. Individual estimates within the aggregation span from a low of €5.05 to a high of €13.12, with the downward revision attributed to analyst cuts following the full-year 2025 results and the group’s guidance reset (Fintel, 12 March 2026).
Reuters (bond issuance context)
Reuters reports that Stellantis priced a multi-tranche €5.0bn hybrid bond offering on 10 March 2026, attracting peak order books of more than €19.0bn across two euro tranches and one pound sterling tranche. Analysts described the transaction as a liquidity management measure intended to support the group’s balance sheet ahead of approximately €2.0bn in cash restructuring payments due during 2026, while the bond pricing offered an external reference point for investor confidence in the credit (Reuters, 11 March 2026).
TradingView (analyst aggregate)
TradingView aggregates analyst submissions for STLAM and reports an average 12-month price target of €9.04, with a high estimate of €12.50 and a low of €6, based on the latest available broker submissions compiled on the platform. The midpoint sits approximately 60% above the last STLAM close of €5.63 as of 19 March 2026, reflecting the gap between current trading levels and longer-dated fundamental valuations (TradingView, 17 March 2026).
Predictions and third-party forecasts are inherently uncertain, as they cannot fully account for unexpected market developments. Past performance is not a reliable indicator of future results.
STLAM stock price: Technical overview
According to TradingView data, on the daily chart, the STLAM stock price trades at €5.63 as of 11:37am UTC on 19 March 2026, positioned below every major moving average and within a pronounced bearish alignment. The 20/50/100/200-day SMAs stack at €6.21, €7.15, €8.24 and €8.31, each sitting well above the current price, confirming a sell signal across the full MA ladder. The Hull moving average (9) at €5.68 adds a near-term directional cue that also points lower, while the volume-weighted moving average (20) at €6.26 reinforces the overhead supply zone beginning just above the intraday high of €5.87.
Momentum is weak but not yet oversold on all measures. The 14-day RSI sits at 32.0, in lower-neutral territory and approaching the conventional oversold threshold, without having crossed it decisively. The ADX (14) reads 33.1, indicating an established and active downtrend rather than a directionless range, which tempers any interpretation of the RSI level as an imminent reversal signal.
On the topside, the classic pivot point (P) at €7.16 represents the first meaningful overhead reference; a daily close back above that level would bring R1 at €8.60 into view. The Ichimoku base line at €6.25 and the 10-day SMA at €5.88 form a nearer interim ceiling just above the intraday high.
On the downside, S1 at €5.51 is the immediate reference below the current price of €5.63, followed by S2 at €4.08. A close below €5.51 could open the way to the S2 zone, as there is no major MA shelf below the current price to provide structural support (TradingView, 19 March 2026).
This is technical analysis for informational purposes only and does not constitute financial advice or a recommendation to buy or sell any instrument.
Stellantis share price history (2024–2026)
STLAM’s stock price traded near €27.24 around March 2024 , marking the high-water mark of the two-year window, before a long, largely uninterrupted slide began to take hold.
Through the second half of 2024, the stock shed roughly half its value, falling from that peak to close at €12.44 on 30 September 2024, as investor confidence in the group’s EV strategy eroded and earnings guidance was repeatedly cut. It ended 2024 at €12.60, down sharply from the spring highs, and carried that weakness into 2025.
By 19 March 2025, STLAM was changing hands at €11.66, and the selling accelerated through late 2025 and into early 2026. The sharpest single-day move came on 6 February 2026, when the stock closed at €6.23, a fall of around 24% in one session, after Stellantis unveiled a €22.2 billion strategic reset and suspended its dividend.
A brief recovery lifted the price back towards €6.98 by 27 February 2026, but the rebound faded. STLAM closed at €5.63 on 19 March 2026, approximately 42.0% down year to date and 51.7% down year on year.
Past performance is not a reliable indicator of future results. Share prices are indicative and may differ from live market prices.
Stellantis (STLAM): Capital.com analyst view
Stellantis has endured one of the most difficult stretches in its short history as a merged group, with the STLAM share price losing around 79% from its two-year high near €27.24 to the current €5.63. The February 2026 strategic reset, including a €22.2 billion charge, the dividend suspension, and an acknowledgement that EV adoption forecasts were more optimistic than realised market conditions, marked a clear reset of market expectations. For some observers, the depth of the sell-off may already reflect much of the negative backdrop, particularly given the group’s stated 2026 revenue recovery plan and active talks with Chinese EV partners Xiaomi and Xpeng, which may bring fresh capital and technology into European operations.
That said, the risks remain substantial and should not be understated. A 15% US tariff on EU vehicle exports, credit rating downgrades to the lowest investment-grade tier, and a broad consensus of Hold or worse from covering analysts suggest the path to recovery is neither straight nor guaranteed. Any deterioration in European auto demand, a breakdown in partnership talks, or further margin pressure could weigh on the price from current levels, just as easily as positive newsflow could lift it.
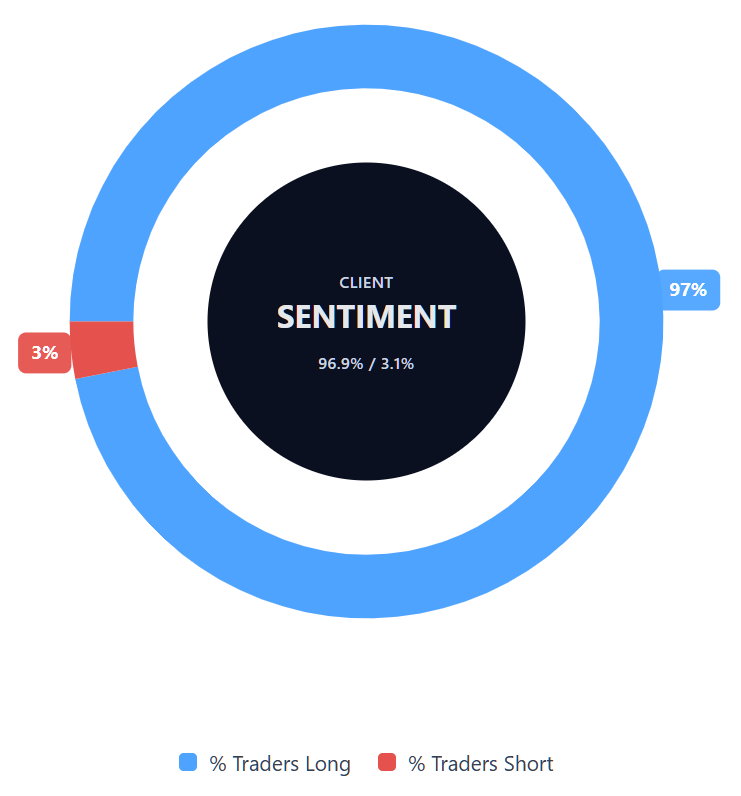
Capital.com’s client sentiment for Stellantis CFDs
As of 19 March 2026, Capital.com client positioning in Stellantis CFDs reads 96.9% buyers and 3.1% sellers, putting buyers ahead by 93.8 pp and leaving positioning firmly one-sided towards longs. This snapshot reflects open positions on Capital.com and can change rapidly as market conditions evolve.
Summary – Stellantis 2026
- STLAM trades at €5.63 as of 11:37am UTC on 19 March 2026, down 42.0% year to date and 51.7% year on year.
- Classic pivot support is assessed against €7.16, with S1 at €5.51 as the immediate downside reference; no major moving average shelf lies below current price levels.
- Key drivers include Stellantis’s €22.2 billion strategic reset, dividend suspension, historic 2025 net loss of €22.3 billion, and a 15% US tariff on EU vehicle exports.
- Stellantis has held talks with Chinese EV makers Xiaomi and Xpeng over potential stakes in European operations, including Maserati, with no deal finalised as of 12 March 2026.
Past performance is not a reliable indicator of future results.
FAQ
Who owns the most Stellantis stock?
What is the 5 year Stellantis share price forecast?
Is Stellantis a good stock to buy?
Could Stellantis stock go up or down?
Should I invest in Stellantis stock?
Can I trade Stellantis CFDs on Capital.com?
Yes, you can trade Stellantis CFDs on Capital.com. Trading share CFDs lets you speculate on price movements without owning the underlying asset and to take long or short positions. However, contracts for difference (CFDs) are traded on margin, and leverage amplifies both profits and losses. You should ensure you understand how CFD trading works, assess your risk tolerance, and recognise that losses can occur quickly.