Stellantis stock forecast: Q1 results and US tariffs
Stellantis reported higher Q1 2026 revenues and a return to net profit, but negative free cash flow and higher US auto tariffs kept pressure on the stock. Explore third-party STLAM price targets and technical analysis. Past performance is not a reliable indicator of future results.
Stellantis N.V. (STLAM) is trading at €6.50 in early European trading as of 10:02am UTC on 6 May 2026, near the top of its intraday range of €6.04–€6.54. Past performance is not a reliable indicator of future results.
Pressure on the stock follows Stellantis's Q1 2026 results, released on 30 April 2026. Net revenues rose 6% year on year to €38.1bn and the group returned to a net profit of €377m, while industrial free cash flow remained negative at –€1.9bn (Stellantis, 30 April 2026). That missed analyst expectations of approximately –€1.2bn and appeared to weigh on sentiment. Stellantis is also preparing to unveil a new long-term business plan on 21 May 2026 (Reuters, 30 April 2026). Broader macroeconomic headwinds include President Trump’s announcement on 30 April 2026 that tariffs on EU-built cars and trucks would rise to 25% from the previously agreed 15% ceiling, a move that triggered a 2%–3% decline across European auto stocks (The Journal, 1 May 2026).
Stellantis stock forecast 2026–2030: Third-party price targets
As of 6 May 2026, third-party Stellantis stock predictions reflect a range of views shaped by the group's Q1 2026 results, its North America margin recovery, ongoing US auto tariff uncertainty, and the recently announced Microsoft AI partnership.
Kepler Capital Markets (downgrade to Hold)
Kepler Capital Markets downgraded Stellantis from Strong Buy to Hold, removing what had been one of the more constructive ratings on the stock. The revision came amid mixed operational signals, including higher Q1 shipments, execution risk around the Leapmotor China alliance, and an active securities class-action overhang ahead of a June 2026 lead-plaintiff deadline (MarketBeat, 17 April 2026).
Citigroup (reiterated Buy)
Citigroup reiterated a Buy rating on Stellantis and raised its 12-month price target to €7.50 from €7, citing early signs of a potential shift in investor sentiment after the stock had declined approximately 39% year to date at the time of the note. Analyst Harald Hendrikse maintained the stock on the firm's 90-day upside catalyst watch, while flagging near-term profitability pressures in North America and Europe as the key constraint (Yahoo Finance, 31 March 2026).
Zacks Research (upgrade to Hold)
Zacks Research upgraded Stellantis from Strong Sell to Hold ahead of the group's Q1 2026 earnings release on 30 April 2026. The revision reflected improving near-term earnings estimate revisions, with the group's confirmed return to net profit in Q1 2026 and reaffirmed full-year guidance cited as factors supporting the move (MarketBeat, 29 April 2026).
MarketScreener (consensus overview)
MarketScreener aggregates views from 27 analysts covering STLAM on the Milan exchange and records a mean 12-month price target of €8.10, within a range of €5–€12.50, alongside a mean Outperform consensus rating. The spread between the low and high targets reflects differing assumptions on the pace of operating margin recovery and the degree of pass-through from US auto tariffs (MarketScreener, 30 April 2026).
MarketBeat (consensus overview)
MarketBeat tracks 19 Wall Street analysts covering NYSE-listed STLA and records a consensus Hold rating as of 5 May 2026, with an average 12-month price target of $11.12, a high of $15, and a low of $8. The panel composition stands at 2 sell, 10 hold, 5 buy, and 2 strong buy ratings, with Freedom Capital's 1 May 2026 upgrade to Strong Buy among the most recent actions lifting the buy-side count (MarketBeat, 5 May 2026).
Predictions and third-party forecasts are inherently uncertain, as they cannot fully account for unexpected market developments. Past performance is not a reliable indicator of future results.
STLAM stock price: Technical overview
The STLAM stock price trades at €6.50 as of 10:02am UTC on 6 May 2026, below its key moving-average cluster. According to TradingView data, the 20-, 50-, 100-, and 200-day simple moving averages sit at approximately €6.83, €6.40, €7.46, and €8, respectively. The price is trading between the 50-day SMA at €6.40 and the 20-day SMA at €6.83, with no clear bullish alignment across the major moving-average group at this stage.
Momentum indicators from TradingView show the 14-day relative strength index at 46.80, below the 50 midpoint and in neutral-to-bearish territory. The average directional index (14) reads 23.40, suggesting the current trend lacks strong conviction in either direction, and remains below the 25 threshold often associated with a more established directional move.
On the topside, the classic R1 pivot at €7.18 is the first reference above the current price. A daily close above that level would put the R2 area near €8.15 back in view. On the downside, the classic pivot (P) at €6.56 sits just above the latest price and acts as an initial reference. Below that, the S1 pivot at €5.60 represents the next meaningful level, with the 50-day SMA at €6.40 providing a near-term moving-average shelf in between (TradingView, 6 May 2026).
This technical analysis is for informational purposes only and does not constitute financial advice or a recommendation to buy or sell any instrument.
Stellantis earnings
Stellantis reported its Q1 2026 financial results on 30 April 2026, posting net revenues of €38.1bn, up 6% yearon year, as consolidated shipments rose 12% to 1.4m units, with all regions contributing to the increase. Industrial free cash flow remained negative at –€1.9bn, though the figure represented a 37% improvement year on year and reflected, in part, approximately €700m of cash outflows tied to H2 2025 restructuring charges. Stellantis noted that the result also followed a €5bn hybrid perpetual notes issuance completed in March 2026, which lifted industrial available liquidity to €44.1bn, equivalent to 28% of trailing 12-month net revenues and within the company's stated 25%–30% target range.
Management confirmed its full-year 2026 financial guidance, targeting improvements in net revenues, adjusted operating income margin, and industrial free cash flow relative to 2025.
Net profit returned to €377m, reversing a loss of €387m in Q1 2025, while adjusted operating income reached €1bn at a 2.5% margin, a 160-basis-point improvement versus the prior-year period. North America was cited as the primary volume driver, with Ram and Jeep flagged as key contributors, while Europe moved back to broadly breakeven (Stellantis, 30 April 2026).
Stellantis share price history (2024–2026)
STLAM’s stock price traded broadly in the €18–€21 range through mid-2024, touching a two-year high of €21.63 on 15 May 2024 as investor sentiment remained relatively constructive around the group’s post-merger integration. From there, the stock entered a prolonged decline, sliding through the second half of 2024 amid concerns over slowing North American volumes, elevated inventory levels, and the unexpected departure of CEO Carlos Tavares in December 2024. The share closed the year at roughly €12.60.
The selling pressure deepened into early 2025, with the stock peaking near €13.57 in February before resuming its downtrend. By late March 2025, Stellantis was trading around €11.44. The announcement of sweeping US tariffs in early April 2025 then accelerated the decline, with the stock falling to around €8.04 by 7 April 2025 as investors weighed the potential impact on transatlantic vehicle shipments.
A partial recovery followed through mid-2025, with prices climbing back towards the €9–€10 range by December 2025, supported by stabilising sentiment around the group’s strategic reset. A sharper move lower arrived in early February 2026, when the stock fell from €8.21 on 5 February to €6.23 on 6 February 2026 in a single session, coinciding with Stellantis publishing a €22.20bn net loss for FY 2025. STLAM has since traded broadly between €5.50 and €7.50 and is currently changing hands at €6.50 as of 6 May 2026, approximately 32.5% lower year on year.
Past performance is not a reliable indicator of future results. Share prices are indicative and may differ from live market prices.
Stellantis (STLAM): Capital.com analyst view
Stellantis’s price trajectory over the past two years reflects a company undergoing significant structural change. The stock has declined sharply from levels above €21 in mid-2024, pressured by weaker North American volumes, inventory build-up, and a leadership transition following the departure of CEO Carlos Tavares. The group’s return to net profit in Q1 2026, alongside reaffirmed full-year guidance, could be interpreted as early evidence that the operational reset is gaining traction. However, negative industrial free cash flow of –€1.90bn in the same quarter shows that the recovery remains incomplete.
The broader backdrop adds further uncertainty. US tariffs on EU-built vehicles, raised to 25% in late April 2026, represent a tangible headwind for Stellantis’s transatlantic business, given its exposure to the North American market through brands such as Jeep and Ram. At the same time, an investor day scheduled for 21 May 2026, where management is expected to outline a longer-term strategic plan, could act as a catalyst in either direction by providing further clarity on the group’s recovery plan or highlighting the scale of the challenges still ahead.
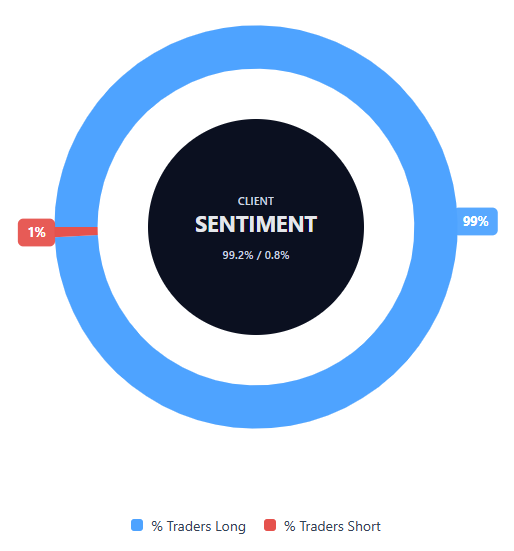
Capital.com’s client sentiment for Stellantis CFDs
As of 6 May 2026, Capital.com client positioning in Stellantis CFDs shows 99.2% long versus 0.8% short. That puts buyers ahead by 98.4 percentage points and places sentiment in strongly long-leaning territory. This snapshot reflects open positions on Capital.com and can change.
Summary – Stellantis 2026
- Stellantis (STLAM) trades at €6.50 as of 10:02am UTC on 6 May 2026, down sharply from a two-year high of €21.63 in May 2024 and following a February 2026 decline that coincided with the publication of a €22.20bn FY 2025 net loss.
- Technical indicators from TradingView show the price trading below the 20-, 100-, and 200-day simple moving averages, while sitting above the 50-day SMA. The 14-day RSI stands at 46.80 in neutral-to-bearish territory, while the ADX at 23.40 signals no firmly established directional trend.
- Key drivers include US auto tariffs raised to 25% on EU-built vehicles, Stellantis’s ongoing North America margin recovery, and negative industrial free cash flow of –€1.90bn reported in Q1 2026.
- Q1 2026 results showed a return to net profit of €377m and revenues of €38.10bn, with management reaffirming full-year guidance, though the free cash flow miss weighed on the share price around the 30 April release.
Past performance is not a reliable indicator of future results.
FAQ
Who owns the most Stellantis stock?
Stellantis has a broad shareholder base that includes institutional investors, strategic shareholders and public market investors. The largest holdings can change over time, so traders and investors should check the company’s latest regulatory filings, annual report and investor relations materials for the most up-to-date ownership breakdown. Ownership structure may be relevant because large shareholders can influence governance, strategy and market perception, but it should be considered alongside financial performance, cash flow and broader sector conditions.
What is the five-year Stellantis share price forecast?
A five-year STLAM stock forecast would depend on several variables, including the group’s margin recovery, cash flow performance, product strategy, tariff exposure and progress in North America and Europe. Analyst price targets cited in the article focus on 12-month views rather than five-year forecasts, with published targets showing a wide range of outcomes. Longer-term forecasts are inherently uncertain, so they should be treated as scenarios rather than reliable predictions of future price performance.
Is Stellantis a good stock to buy?
Whether Stellantis is a good stock to buy depends on each investor’s objectives, risk tolerance and view of the company’s recovery prospects. The stock has fallen sharply from its 2024 highs, while Q1 2026 results showed a return to net profit and reaffirmed full-year guidance. However, negative industrial free cash flow, US tariff uncertainty and execution risks remain important considerations. This information is not financial advice or a recommendation to buy or sell Stellantis shares.
Could Stellantis stock go up or down?
Stellantis stock could move in either direction. Potential upside drivers include evidence of stronger margins, improved cash flow, clearer strategy at the 21 May 2026 investor day, and progress in North America. Downside risks include weaker demand, tariff pressure, further cash flow shortfalls or slower-than-expected execution of the group’s recovery plan. Technical indicators cited in the article show no firmly established trend, which underlines the need to consider both positive and negative scenarios.
Should I invest in Stellantis stock?
The decision to invest in Stellantis stock should be based on independent research, personal financial circumstances and, where appropriate, professional advice. The article highlights both supportive factors, such as a return to net profit in Q1 2026, and risks, including negative industrial free cash flow and tariff-related uncertainty. Past performance is not a reliable indicator of future returns, and share prices can fall as well as rise. This content does not constitute investment advice.
Can I trade Stellantis CFDs on Capital.com?
Yes, you can trade Stellantis CFDs on Capital.com. Trading share CFDs lets you speculate on price movements without owning the underlying asset and to take long or short positions. However, contracts for difference (CFDs) are traded on margin, and leverage amplifies both profits and losses. You should ensure you understand how CFD trading works, assess your risk tolerance, and recognise that losses can occur quickly.