Stellantis stock forecast: €22.2bn charges and dividend suspension
Stellantis is a multinational carmaker listed in Milan and New York, recently booking €22.2bn in H2 2025 charges, suspending its 2026 dividend and planning up to €5bn in hybrid bonds ahead of full-year results. Explore third-party STLAM price targets and technical analysis.
Stellantis N.V. (STLAM) is trading around €6.49 as of 11:01am on 23 February 2026 (UTC), positioned near the middle of its intraday range between €6.42 and €6.62 on Capital.com’s EUR market. Past performance is not a reliable indicator of future results.
Recent trading is taking place against the backdrop of a major business reset in which Stellantis booked around €22.2bn of charges in the second half of 2025, linked to revised product plans and lower battery-electric vehicle expectations (Reuters, 6 February 2026). The group also decided not to pay a 2026 dividend and outlined plans to issue up to €5bn of hybrid bonds to support liquidity (Stellantis, 6 February 2026). Market attention now centres on full-year 2025 results due on 26 February 2026 and on management’s intention to present a new product strategy and longer-term financial framework later in the year (Stellantis, 16 February 2026).
Stellantis stock forecast 2026–2030: Third-party price targets
As of 23 February 2026, third-party Stellantis stock predictions cover a broad range. This spread reflects differing assumptions about restructuring charges, the pace of earnings recovery and wider automotive-sector conditions, rather than any assured price outcome. These third-party estimates are indicative only, may differ from Capital.com pricing, and do not constitute investment advice.
Stock Analysis (consensus snapshot)
Stock Analysis reports that six analysts covering US-listed Stellantis (STLA) assign an average 12-month price target of $11.79. Individual forecasts range between $9 and $15, with an overall Buy consensus. The platform notes that analysts refer to valuation levels, margin potential and execution of the group’s revised strategy in forming their views (Stock Analysis, 17 February 2026).
Deutsche Bank (broker target cut)
Deutsche Bank reduces its 12-month STLAM stock forecast from €8 to €7 while maintaining a Neutral rating. The broker referenced large announced charges and weaker-than-expected automotive operating-income margins as key factors in its revised model (Investing.com, 9 February 2026).
WallStreetZen (US-listed STLA coverage)
WallStreetZen’s summary for US-listed Stellantis (STLA) refers to a group of Wall Street analyst 12-month price targets clustered in the low- to mid-teens US-dollar range. The platform states that the average target implies potential upside relative to prevailing prices, while emphasising that these projections depend on earnings and margin assumptions that may change as new information emerges (WallStreetZen, 20 February 2026).
Predictions and third-party forecasts are inherently uncertain, as they cannot fully account for unexpected market developments. Past performance is not a reliable indicator of future results.
STLAM stock price: Technical overview
The STLAM stock price is trading around €6.49 as of 11:01am on 23 February 2026 (UTC), remaining below its main daily moving-average band and closer to the lower end of recent pivot levels. On the daily chart, the simple moving-average cluster sits above the current price, with the 20/50/100/200-day moving averages grouped near €7, €8, €9 and €9 respectively. The 14-day RSI, at around 32.9, places momentum in a lower-neutral zone, while the ADX near 34.6 indicates an established trend rather than a range-bound market.
On the topside, the nearest classic resistance level appears around €9.42 (R1), with €10.56 (R2) coming into focus only after a sustained daily close above that first pivot area. On pullbacks, the classic pivot near €8.72 serves as an initial reference, followed by the 100-day SMA around €8.74 as the next technical area of interest. A clear break below that region could expose the €7.58 area near S1 on the classic pivot grid (TradingView, 23 February 2026).
This technical analysis is provided for informational purposes only and does not constitute financial advice or a recommendation to buy or sell any instrument.
Stellantis share price history (2024–2026)
STLAM’s stock price – Stellantis’ Milan-listing – has experienced a pronounced two-year swing, moving from the mid-€20s in early 2024 to single-digit levels by early 2026. The stock closed at €24.39 on 26 February 2024 and moved higher into the spring, peaking around €26–€27 in late March. It later traded near €18–€19 in June and reached around €19–€20 into late summer 2024. Momentum then moderated, with the price easing back through the low- to mid-teens and finishing 2024 closer to €12–€13 as the earlier rally faded.
In 2025, Stellantis initially traded within a relatively narrow €12–€13 range through January and February before trending lower in the second half of the year. The price moved from around €13–€14 in February to below €9 by late September and closed at €9.49 on 30 December 2025. The decline intensified in early 2026: from €9.71 on 2 January, the share price fell through the high-€8s and dropped sharply on 6 February, closing at €6.23 after an intraday low of €5.75. It later stabilised in the mid-€6 range. By 23 February 2026, Stellantis was trading at €6.49, significantly below its levels of two years earlier.
Past performance is not a reliable indicator of future results. Share prices are indicative and may differ from live market prices.
Stellantis (STLAM): Capital.com analyst view
Stellantis’ share price has undergone a substantial repricing, moving from the mid-€20s in early 2024 to around €6.49 as of 11:01am on 23 February 2026 (UTC). Much of this adjustment has occurred over the past year. After trading largely between €18 and €26 during much of 2024 and moving into single-digit territory over 2025, the stock fell sharply in early February 2026 before stabilising in the mid-€6 area. This sequence illustrates how quickly market positioning can shift when significant charges and strategic changes coincide with a softer sector backdrop. Past performance is not a reliable indicator of future results.
Recent developments include the booking of approximately €22.2bn in charges linked to scaling back parts of the company’s electric-vehicle plans, the suspension of the 2026 dividend and plans to issue up to €5bn in hybrid bonds. Reports have also referenced a renewed focus on diesel and combustion-engine models in parts of Europe as EV demand evolves. Some market participants may view these measures as steps to protect liquidity and recalibrate the product mix. Others may focus on execution risk, regulatory uncertainty and the financial impact of transition costs.
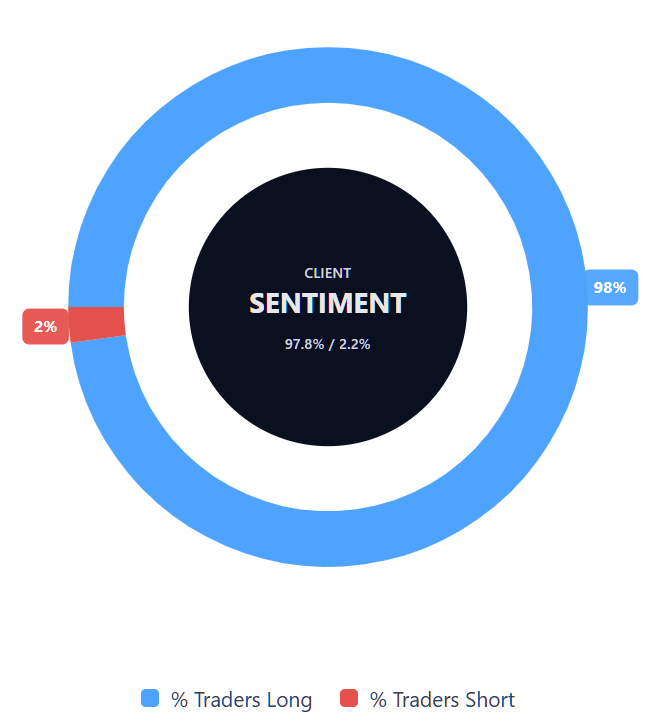
Capital.com’s client sentiment for Stellantis CFDs
As of 23 February 2026, Capital.com client positioning in Stellantis CFDs remains heavily skewed towards long positions, with buyers at 97.8% and sellers at 2.2%, leaving a net long differential of approximately 95.6 percentage points. This snapshot reflects open positions on Capital.com at the time of writing and may change.
Summary – Stellantis 2026
- As of 11:01am UTC on 23 February 2026, Stellantis traded near €6.49, well below its mid-€20s levels in early 2024 and below the double-digit prices seen through much of 2024 and early 2025.
- Daily technical indicators show the price holding below its 20/50/100/200-day moving-average cluster in the €7–€9 region, with the RSI near 33 and the ADX above 25, suggesting an established downward trend at the time of observation.
- Key themes include sizeable EV-related write-downs, the suspension of the 2026 dividend, planned hybrid bond issuance and adjustments to the product strategy across battery-electric, hybrid and combustion models.
- Recent reporting has focused on the €22.2bn charges linked to the EV pullback, commentary around a shift towards diesel offerings in Europe and the upcoming full-year 2025 results scheduled for 26 February 2026.
Past performance is not a reliable indicator of future results.
FAQ
Who owns the most Stellantis stock?
Stellantis’ largest shareholders typically include founding family holding companies, long-term institutional investors and global asset managers. Public filings indicate that entities linked to the Agnelli family, through Exor, hold a significant stake, alongside investment firms and pension funds. Ownership levels can shift over time as institutions adjust allocations or rebalance portfolios, so investors may wish to review the latest regulatory filings for the most up-to-date breakdown.
What is the 5-year Stellantis share price forecast?
There is no single, agreed five-year STLAM stock forecast. Most published analyst estimates focus on 12-month price targets rather than longer time horizons. Over a five-year period, performance would depend on factors such as restructuring progress, electric-vehicle strategy, cost management, global automotive demand and regulatory developments. Longer-term projections are inherently uncertain and are typically presented as scenario-based assumptions rather than reliable indicators of future performance.
Is Stellantis a good stock to buy?
Whether Stellantis is considered ‘good’ will depend on an individual’s objectives, risk tolerance and time horizon. The company is undergoing a strategic reset, including sizeable writedowns and adjustments to its product mix, which introduce both risks and potential upside. Share price volatility, sector conditions and execution challenges may all influence outcomes. Market participants often assess financial results, valuation metrics and industry trends before making decisions. This information is general in nature and does not constitute investment advice.
Could Stellantis stock go up or down?
Stellantis’ share price may move in either direction, depending on earnings performance, restructuring progress, product demand and broader automotive-sector trends. External variables such as interest rates, consumer confidence, input costs and regulatory policy can also affect valuation. Technical indicators may highlight prevailing trends at a given time, but market conditions can change as new information becomes available. Price movements are not guaranteed and may be volatile.
Should I invest in Stellantis stock?
Only you can determine whether investing in Stellantis aligns with your financial goals and risk profile. Shares in automotive manufacturers often experience significant price fluctuations, particularly during periods of strategic transition or sector disruption. It is important to consider your investment horizon, portfolio diversification and tolerance for potential losses. This material is provided for general information only and does not constitute investment advice.
Can I trade Stellantis CFDs on Capital.com?
Yes, you can trade Stellantis CFDs on Capital.com. Trading share CFDs lets you speculate on price movements without owning the underlying asset and to take long or short positions. However, contracts for difference (CFDs) are traded on margin, and leverage amplifies both profits and losses. You should ensure you understand how CFD trading works, assess your risk tolerance, and recognise that losses can occur quickly.