Stellantis stock forecast: €22.2bn charges, US tariff
Stellantis (STLAM) trades on Borsa Italiana and has fallen near multi-year lows after €22.2bn H2 2025 charges; management expects sequential improvement in 2026 amid a 15% US tariff. Past performance is not a reliable indicator of future results. Explore third-party STLAM price targets and analysis.
Stellantis N.V. (STLAM) is trading at €5.99 on the Borsa Italiana in early European trading at 11:32am (UTC) on 11 March 2026, within an intraday range of €5.91–€6.18. The stock has traded near multi-year lows following a steep decline from its 52-week high of approximately €12.07, reflecting ongoing pressure since the group’s full-year 2025 results. Past performance is not a reliable indicator of future results.
Sentiment remains weighed down by Stellantis’s disclosure of approximately €22.2bn in charges for the second half of 2025, primarily related to revised battery-electric vehicle projections and cancelled product programmes (Stellantis, 26 February 2026). CEO Antonio Filosa guided for sequential improvement in net revenues, AOI margin, and cash generation across 2026 (Bloomberg, 26 February 2026). The company is also navigating a 15% US tariff on EU-built vehicles, applied retroactively from 1 August 2025 under the US-EU trade framework, which continues to pressure margins on transatlantic shipments (Reuters, 25 September 2025). Broader European auto sector conditions add further headwinds, with EU new-car registrations falling for a second consecutive January (Reuters, 24 February 2025) and intensifying competition from Chinese manufacturers forecast to raise their Western European market share in 2026 (S&P Global, 9 March 2026).
Stellantis stock forecast 2026–2030: Third-party price targets
As of 11 March 2026, third-party Stellantis stock predictions have been revised broadly lower since the group’s February 2026 full-year results, which included €22.2bn in reset charges and a dividend suspension. The following targets represent a selection of published estimates and consensus snapshots.
Freedom Capital Markets (house view, downgrade)
Freedom Capital Markets downgrades Stellantis (NYSE: STLA) to Hold from Buy and cuts its 12-month price target to $8 from $9, citing mounting margin pressure and continued operating headwinds through 2026. The firm revises its 2026 net income estimate down to €3.4bn from €4.5bn and projects 2027 net income at €4.6bn, as the group’s restructuring execution and 2026 guidance imply persistent near-term earnings compression (Investing.com, 2 March 2026).
MarketBeat (Wall Street consensus)
MarketBeat reports a consensus Hold rating with an average 12-month STLA price target of $11.12, spanning individual estimates from $8 to $15. The service notes the downward drift in consensus targets following the February results, as analysts weigh cyclical auto demand headwinds against the group’s stated mid-single-digit net revenue growth guidance for 2026 (MarketBeat, 11 March 2026).
MarketScreener (multi-broker consensus)
MarketScreener reports a mean consensus rating of Outperform across 27 analysts covering Stellantis, with an average 12-month STLAM stock forecast of €8.28, a high estimate of €16, and a low estimate of €5, representing a spread of +38.3% above the last close price of €5.987. Targets reflect a broad range of views as analysts assess the scope of restructuring charges, credit rating downgrades by S&P and Moody’s to lowest investment grade, and the group’s 2026 revenue recovery plan (MarketScreener, 9 March 2026).
RBC Capital Markets (house view, Neutral)
RBC Capital Markets analyst Tom Narayan reiterates a Neutral rating on STLAM with a 12-month price target of €6, unchanged after the full-year results. The firm maintains its cautious stance amid broadly flat pricing guidance from Stellantis management for 2026 and ongoing pressure on operating margins as the group restructures its EV strategy (MarketScreener, 27 February 2026).
Bernstein (house view, Neutral)
Bernstein cuts its 12-month USD-listed price target on Stellantis to $7.30 from $9.90, retaining a Neutral rating, after revising its margin forecasts lower in the wake of the February results. The firm applies an EUR/USD exchange rate of 1.18 to its EUR-denominated base-case model and flags persistent margin concerns as the key constraint on any near-term re-rating (Investing.com, 27 February 2026).
Predictions and third-party forecasts are inherently uncertain, as they cannot fully account for unexpected market developments. Past performance is not a reliable indicator of future results.
STLAM stock price: Technical overview
The STLAM stock price trades at €5.99 as of 11:32am UTC on 11 March 2026, within an intraday range of €5.91–€6.18, with the price sitting below the full moving-average stack, a configuration that reflects an entrenched downtrend across all measured timeframes.
The 20/50/100/200-day SMAs stand at approximately €6.46 / €7.59 / €8.45 / €8.41, all rolling lower and each acting as overhead resistance. Price has not reclaimed the SMA-10 at €6.34, which supports the sell signal across the MA ladder. The 14-day RSI reads 35.5, placing it in lower-neutral territory and near the boundary of oversold conditions, while the ADX at 32.1 indicates an established trend and adds weight to the prevailing directional bias.
On the topside, the classic R1 pivot at €8.60 represents the first meaningful reference above current levels. A daily close back above the pivot point at €7.16 would be a preliminary step before R1 comes into view. The hull moving average (9-day) at €5.94 sits just below spot and is the sole buy signal in the MA complex, reflecting the short-term rate of change, while the VWMA-20 at €6.47 reinforces the nearest overhead cluster.
On pullbacks, the classic pivot point at €7.16 is now distant resistance rather than support. Immediate intraday support rests near the S1 classic level at €5.51. A daily close below €5.91, the intraday session low, would risk a move toward the S2 area at €4.08, while holding above S1 at €5.51 is the minimum condition for any near-term consolidation (TradingView, 11 March 2026).
This is technical analysis for informational purposes only and does not constitute financial advice or a recommendation to buy or sell any instrument.
Stellantis share price history (2024–2026)
STLAM’s stock price was trading around €25.50–€27 in March 2024, a period that marked the recent high-water mark for the stock over the past two years.
The decline from those levels was sharp and prolonged. Shares slipped steadily through the second half of 2024, falling from around €19 in June to €12 by December, as a series of profit warnings and executive departures pressured sentiment. The stock opened 2025 near €12.64 and held relatively steady in the €12–€13.60 range through to mid-February, before a further leg lower took hold in March.
By late February 2025, STLAM was near €12.45, and the decline accelerated from there, with shares sliding through the spring to test €8 levels in April and May amid broader tariff concerns. A partial recovery lifted the price back toward €10.50 by early December 2025, but that proved short-lived.
The most dramatic move came on 6 February 2026, when STLAM gapped down from €8.21 to close at €6.23 after the group disclosed €22.2bn in reset charges and suspended its dividend. The stock has not recovered meaningfully since, trading near €5.99–€6.50 through early March 2026.
STLAM closed at €6.03 on 11 March 2026, approximately 50.5% down year on year and approximately 76.5% below its March 2024 levels.
Past performance is not a reliable indicator of future results. Share prices are indicative and may differ from live market prices.
Stellantis (STLAM): Capital.com analyst view
Stellantis’s price performance over the past two years reflects a company in structural transition. Shares have fallen sharply from around €25.50 in early 2024 to approximately €5.99 by 11 March 2026, weighed down by a succession of profit warnings, a CEO departure, and ultimately a €22.2bn reset charge disclosed in February 2026 alongside a dividend suspension. Some analysts point to the group’s H2 2025 sequential improvements, a $13bn commitment to US manufacturing, and management’s 2026 guidance for mid-single-digit revenue growth and a return to positive AOI margin as potential support for a gradual recovery; some DCF models place intrinsic value materially above the current spot price. Others highlight that the restructuring path carries significant execution risk, with approximately €2bn in cash restructuring payments due in 2026, credit rating downgrades by both S&P and Moody’s to lowest investment grade, and ongoing pricing pressure across European markets.
The broader context adds further complexity. A 15% US tariff on EU-built vehicles, which Stellantis estimates will cost approximately €1.6bn in 2026, could compress margins further if the group is unable to offset the impact through pricing or production shifts. Conversely, any easing of trade tensions or a weaker euro could provide partial relief. The stock’s valuation, now near multi-year lows, may draw interest from market participants looking for evidence of stabilisation, though the dividend suspension removes a key income-driven support, and management currently guides to a return to positive industrial free cash flow in 2027 at the earliest.
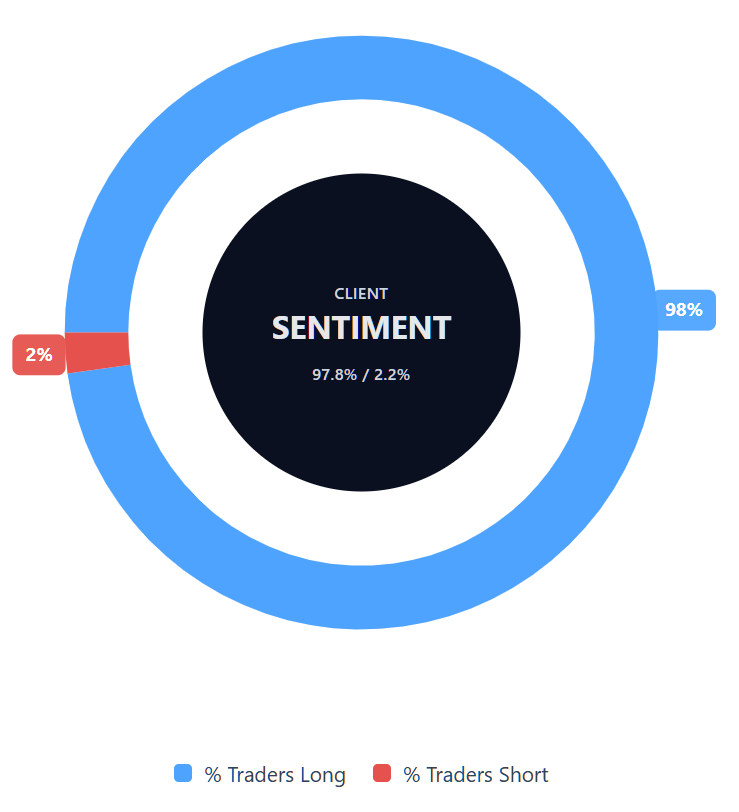
Capital.com’s client sentiment for Stellantis CFDs
As of 11 March 2026, Capital.com client positioning in Stellantis CFDs shows 97.8% buyers vs 2.2% sellers, which puts buyers ahead by 95.6 percentage points and places sentiment firmly in one-sided long territory. This snapshot reflects open positions on Capital.com and can change.
Summary – Stellantis 2026
- STLAM trades at €5.99 as of 11:32am UTC on 11 March 2026, down roughly 76.5% from March 2024 levels near €25.50.
- The full moving-average stack sits well above spot, with the 20/50/100/200-day SMAs ranging from €6.46 to €8.45, and the ADX at 32.1 confirms an established downtrend.
- The 14-day RSI reads 35.5, approaching oversold territory, while the classic pivot point at €7.16 and R1 at €8.60 represent the nearest meaningful overhead references.
- The February 2026 full-year results triggered the sharpest single-session drop, as Stellantis disclosed €22.2bn in reset charges and suspended its dividend.
- A 15% US tariff on EU-built vehicles, estimated to cost approximately €1.6bn in 2026, continues to weigh on the margin outlook alongside weak EU new-car registrations.
Past performance is not a reliable indicator of future results.
FAQ
Who owns the most Stellantis stock?
What is the 5 year Stellantis share price forecast?
Is Stellantis a good stock to buy?
Could Stellantis stock go up or down?
Should I invest in Stellantis stock?
Can I trade Stellantis CFDs on Capital.com?
Yes, you can trade Stellantis CFDs on Capital.com. Trading share CFDs lets you speculate on price movements without owning the underlying asset and to take long or short positions. However, contracts for difference (CFDs) are traded on margin, and leverage amplifies both profits and losses. You should ensure you understand how CFD trading works, assess your risk tolerance, and recognise that losses can occur quickly.