Solana price prediction: Alpenglow upgrade and on-chain activity
Solana is a layer-1 blockchain token trading within a broader crypto rebound, with current focus on its planned Alpenglow upgrade and reported high on-chain activity levels. Explore third-party SOL price targets and technical analysis.
Solana (SOL/USD) is trading around $83.74 on Monday, 2 March 2026, at 12:04pm UTC, moving within an intraday range between a low of $81.95 and a high of $88.13 on Capital.com’s feed. External venue data indicate that SOL has been fluctuating near the mid-$80s in recent sessions after testing resistance close to $89 over the weekend. Past performance is not a reliable indicator of future results..
Recent trading has taken place against the backdrop of a broader crypto market rebound following a sharp sell-off. Some outlets have identified SOL among the stronger large-cap performers during this phase, as traders reacted to dip-buying across digital assets (U.Today, 1 March 2026). On the fundamental side, market commentary continues to focus on Solana’s planned Alpenglow consensus upgrade, which aims to reduce transaction finality to around 100-150 milliseconds (Galaxy, 27 October 2025). Industry sources also point to high on-chain usage metrics, including millions of daily active addresses and elevated transaction counts on the network (BitKE, 1 March 2026).
Solana price prediction 2026-2030: Analyst price target view
As of 2 March 2026, third-party SOL price predictions span a wide range, reflecting differing assumptions about technical patterns, network fundamentals and broader crypto conditions. These targets are indicative and subject to change. Forecasts can be inaccurate, as they cannot account for unforeseen market developments.
Finbold (near-date AI-derived marker)
Finbold reports that its AI-based aggregation of three large language models points to an indicative SOL level of about $89.47 for 1 March 2026. This implied only a modest move from late-February trading levels. The outlet describes a narrow projected range around that level in still-volatile market conditions and emphasises that these outputs serve as scenario markers rather than formal investment recommendations (Finbold, 27 February 2026).
Coinpedia (range-based 2026 framework)
Coinpedia outlines a 2026 Solana framework with a potential low near $70, an average scenario around $200 and an upside case extending towards $500 for the year. It presents these levels in the context of differing macro and liquidity conditions. In its view, SOL could remain within a broad $70-$180 consolidation range if liquidity remains constrained, or move towards $320-$500 should macroeconomic conditions and ecosystem activity improve (Coinpedia, 17 February 2026).
DigitalCoinPrice (year-end 2026 marker)
DigitalCoinPrice sets out a medium-term Solana projection that references a potential move towards approximately $104.12 by the end of 2026, describing this as an indicative level rather than a fixed outcome. Its scenario assumes that SOL may stabilise following early-2026 volatility and record gradual gains, while recognising the possibility of renewed downside pressure if broader market sentiment deteriorates (DigitalCoinPrice, 21February 2026).
InvestingHaven (longer-term 2026 range)
InvestingHaven’s multi-analyst review references external expert inputs and outlines a broad 2026 Solana forecast corridor spanning approximately $111 to $450, with an average near $425 based on several institutional and fund-manager scenarios. The article states that these projections rely on assumptions of continued decentralised finance (DeFi) and non-fungible token (NFT) activity on Solana, potential exchange-traded fund (ETF)-related flows, and the network maintaining or expanding its position within the layer-1 landscape (InvestingHaven, 22 February 2026).
Predictions and third-party forecasts are inherently uncertain, as they cannot fully account for unexpected market developments. Past performance is not a reliable indicator of future results.
SOL price: Technical overview
SOL/USD trades near $83.74 as of 12:04pm UTC on 2 March 2026. The price sits close to the 10-day simple moving average (SMA) around 83 and just above the volume-weighted 20-day average near 83. The broader simple moving-average cluster remains positioned above spot, with the 20-, 50-, 100- and 200-day SMAs at approximately 83, 104, 118 and 156 respectively. This configuration indicates that price continues to trade below several medium- and longer-term trend gauges.
Exponential moving averages (EMAs) show a slightly different alignment. The 10-day EMA stands near 84 and the 20-day EMA around 86, while the 200-day EMA sits near 137.
Momentum indicators present a mixed picture. The 14-day relative strength index (RSI) reads around 43, placing it in neutral territory. The average directional index (ADX) near 42 suggests an established trend rather than a purely range-bound structure, although it does not indicate direction.
On the upside, the classic R1 pivot near 105 marks the first technical reference level. A sustained daily close above that zone could bring the R2 area around 125 into focus as a potential resistance band. On pullbacks, initial support appears near the classic pivot around 86. Below that, traders may monitor the S1 region near 66 as a lower reference point if selling pressure intensifies (TradingView, 2 March 2026).
This technical analysis is for informational purposes only and does not constitute financial advice or a recommendation to buy or sell any instrument.
Solana price history (2024–2026)
On the daily chart, SOL/USD has experienced pronounced price swings over the past two years. The token moved from triple-digit highs to significantly lower levels before stabilising around the mid-$80s into early March 2026.
SOL closed at approximately $179.14 on 2 March 2025 after rallying from the $130-$140 range in late February. Later in 2025, volatility increased. After trading near $238-$256 in late November, SOL retraced towards roughly $124.83 by 31 March and $124.77 by 31 December 2025, as earlier gains moderated.
In 2026, price action has remained corrective so far. SOL began the year around $127.06 on 1 January, briefly reached the mid-$140s in mid-January, and then declined through February. The token settled near $84.20 on 2 March 2026, leaving it well below late-2024 highs but above some of the lower levels recorded during the past year.
Past performance is not a reliable indicator of future results. Share prices are indicative and may differ from live market prices.
Capital.com analyst view: Solana
Over the past two years, Solana’s price has reflected the wider volatility often observed in large-cap crypto assets. The token moved from late-2024 peaks above $250 to closes near $124-$127 by the end of 2025, before easing into the mid-$80s by early March 2026. This trajectory illustrates how rapidly market sentiment can shift in high-beta digital assets, particularly as liquidity conditions and macroeconomic expectations evolve.
From a fundamental perspective, Solana’s investment narrative centres on its high-throughput, low-fee blockchain and expanding ecosystem. Supporters view these characteristics as potential drivers of future network usage and demand. At the same time, critics highlight past network outages, competitive pressure from other layer-1 blockchains and ongoing regulatory uncertainty as material risk factors. As a result, SOL’s price can respond quickly to changes in risk appetite, positioning and broader crypto market flows.
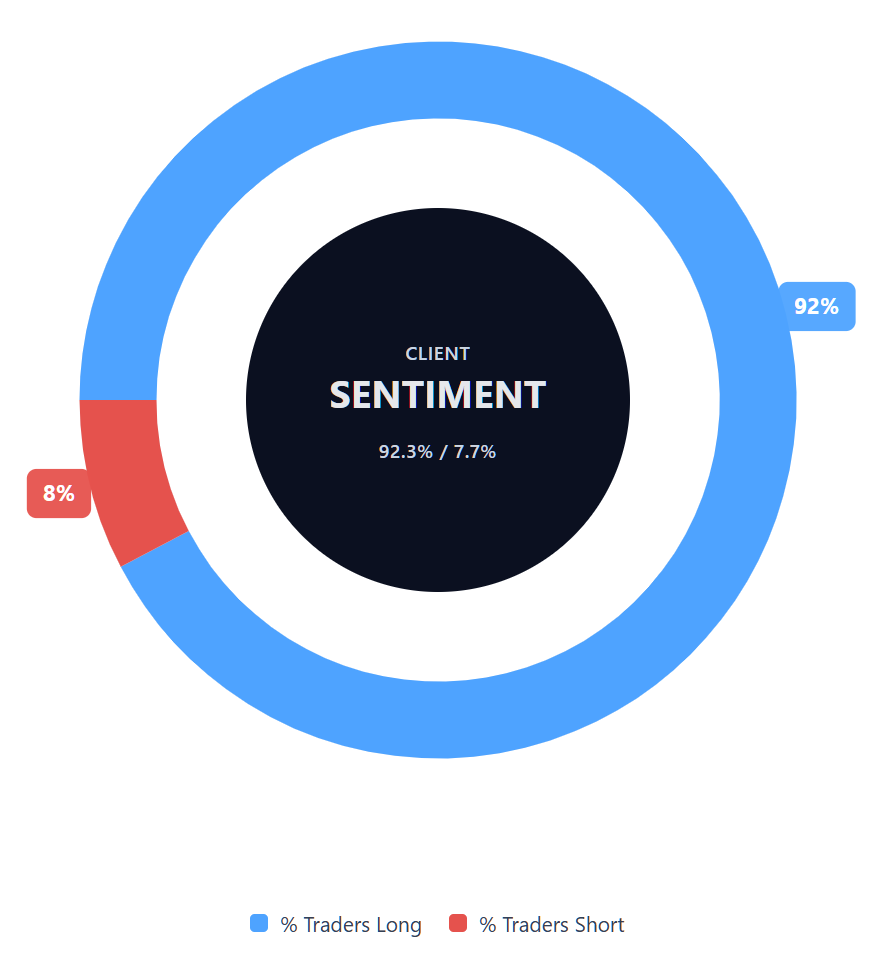
Capital.com’s client sentiment for Solana CFDs
As of 2 March 2026, Capital.com client positioning in Solana CFDs shows buyers at 92.3% and sellers at 7.7%. This results in a net long bias of approximately 84.6 percentage points. Such positioning data reflect the distribution of open positions on the platform at a specific point in time and can change as clients adjust their exposure. Sentiment indicators do not predict future price movements.
Summary – Solana (2026)
- As of early afternoon on 2 March 2026, Solana (SOL/USD) trades near $83.74, below late-2024 highs above $250 but above some longer-term lows.
- Over the past two years, SOL has moved from early-2025 closes near $179-$250 into a broader decline, finishing 2025 around $124.77 before easing into the mid-$80s.
- Technical indicators show price trading near short-term averages, with RSI in neutral territory, while several longer-term moving averages remain above spot, indicating a broader downward trend structure.
- Key influences include overall crypto risk sentiment, developments within Solana’s high-throughput, low-fee ecosystem and activity in decentralised finance and NFTs, alongside competition, past outages and regulatory uncertainty.
- Recent coverage highlights trading in the $80-$90 range, mixed technical signals and continued on-chain activity, illustrating both supportive and cautionary factors currently referenced in the market.
Past performance is not a reliable indicator of future results.
FAQ
What is the latest Solana crypto price prediction?
Who owns the most Solana?
How many Solana coins are there?
Solana does not have a fixed maximum supply in the same way as some other cryptocurrencies. Instead, it operates with an inflationary issuance model, where new SOL tokens enter circulation through staking rewards. The circulating supply changes over time as new tokens are issued and transaction fees are partially burned. As a result, the total and circulating supply figures can vary and should be checked against up-to-date blockchain data sources.
Could Solana’s price go up or down?
Should I invest in Solana?
Can I trade Solana CFDs on Capital.com?
Yes, you can trade Solana CFDs on Capital.com. Trading crypto CFDs lets you speculate on price movements without owning the underlying asset and to take long or short positions. However, contracts for difference (CFDs) are traded on margin, and leverage amplifies both profits and losses. You should ensure you understand how CFD trading works, assess your risk tolerance, and recognise that losses can occur quickly.