Siemens stock forecast: Healthineers spin-off plan
Siemens (SIE) is a German engineering group whose shares are being watched as it plans to spin off about 30% of Siemens Healthineers, with terms expected in early Q2 2026. Explore third-party SIE price targets and technical analysis. Past performance is not a reliable indicator of future results.
Siemens AG (SIE) is trading at €228 in early European trading at 10:12am (UTC) on 11 March 2026, within an intraday range of €226.75–€233.10; the stock remains below its 200-day moving average, reported at approximately €235.53, and has pulled back around 10% over the past month from levels near €250. Past performance is not a reliable indicator of future results.
Pressure on the shares persists amid investor uncertainty surrounding Siemens' announced plan to spin off a roughly 30% stake in its medical technology subsidiary, Siemens Healthineers (Reuters, 12 November 2025). The company is not expected to publish detailed transaction terms until early in the second quarter of 2026, and this has offset otherwise strong Q1 FY2026 results, in which group orders rose 10% year-on-year to €21.4 billion and revenue grew 8% to €19.1 billion, while the order backlog reached a record €120 billion (Siemens, 12 February 2026).
The broader European equity backdrop has also added to the headwinds, with the pan-European STOXX 600 having fallen over 3% in a single session earlier this month amid geopolitical tensions and oil-price-driven inflation concerns (Reuters, 3 March 2026). Siemens also continues to advance its AI strategy through a deepened partnership with NVIDIA to co-develop an industrial AI operating system, while an ongoing €6 billion share buyback programme – of which €4.4 billion has been used – provides some support via a reduced share count. (Siemens, 6 January 2026)
Siemens stock forecast 2026–2030: Third-party price targets
As of 11 March 2026, third-party Siemens stock predictions were updated in early March 2026, as the shares pulled back from the post-results highs reached in mid-February following the group's Q1 FY2026 beat and raised full-year guidance.
J.P. Morgan (Buy reaffirmation)
J.P. Morgan analyst Phil Buller reaffirms a Buy rating on Siemens, maintaining the 12-month SIE stock forecast target of €325 established at the time of the Q1 results. The reaffirmation follows the broader pullback in the shares, with Buller continuing to cite order momentum and AI-related infrastructure demand as the primary supports for his valuation (MarketScreener, 3 March 2026).
Bernstein (Buy reaffirmation)
Bernstein analyst Alasdair Leslie reaffirms a Buy rating on Siemens with a price target of €290. Leslie's view reflects the firm's positive stance on industrial AI platform development and Siemens' medium-term revenue growth trajectory amid the planned Healthineers stake reduction (MarketScreener, 5 March 2026).
The Globe and Mail (consensus snapshot)
The Globe and Mail reports that the prevailing analyst consensus on Siemens stands at Moderate Buy, with an average 12-month price target of €267.33 across contributing brokers. The note accompanies Bernstein's latest reaffirmation and reflects inputs from multiple analysts covering the industrial and automation sectors (The Globe and Mail, 6 March 2026).
MarketScreener (consensus overview)
MarketScreener aggregates 24 analyst estimates for SIE, producing an average 12-month price target of €275.81, with the mean consensus rating standing at Outperform. The platform records individual estimates ranging from €225 to €335, reflecting divergent views on valuation, the timing of the Healthineers restructuring, and the pace of AI-driven order conversion (MarketScreener, 11 March 2026).
Investing.com (consensus overview)
Investing.com reports an average 12-month analyst price target of €275.81 for Siemens, drawn from a pool of contributing brokers. The platform notes the consensus reflects ongoing confidence in the group's industrial automation and digital industries divisions, alongside broader European industrial capex recovery assumptions (Investing.com, 9 March 2026).
Predictions and third-party forecasts are inherently uncertain, as they cannot fully account for unexpected market developments. Past performance is not a reliable indicator of future results.
SIE stock price: Technical overview
The SIE stock price trades at €228 at 10:12am (UTC) on 11 March 2026, with all key moving averages arrayed above the current price and aligned in a uniform sell configuration. The 20/50/100/200-day SMAs sit at approximately €238 / €247 / €242 / €234, each pressing down on price action; notably, the 200-day SMA at €233.75 and the 200-day EMA at €232.92 both sit just above the last print, making that band the immediate overhead barrier. The hull moving average (9) at €224.42 is the sole buy-aligned reading among the moving average suite.
Momentum is muted and moderately negative: the 14-day RSI registers 41.53, a lower-neutral reading that does not yet indicate oversold conditions but reflects the absence of buying pressure. The average directional index (14) reads 15.13, marginally above the 15 threshold, suggesting the prevailing trend lacks conviction in either direction.
On the topside, the classic pivot point at €251.60 represents the first material reference to recover; a daily close through that level would put R1 at €271.55 in view, with R2 near €295.70 as the next reference beyond that. The more immediate task for bulls is reclaiming the 200-day SMA and EMA band in the €233–€234 area, which now acts as overhead resistance.
On pullbacks, initial support sits at S1 on the classic scale near €227.45, closely aligned with the current intraday low of €226.75. Losing that zone would risk a move toward S2 at €207.50; the 100-day SMA at €241.57 remains a ceiling rather than a floor given the current positioning below it (TradingView, 11 March 2026).
This is technical analysis for informational purposes only and does not constitute financial advice or a recommendation to buy or sell any instrument.
Siemens share price history (2024–2026)
SIE’s stock price opened March 2024 around €183, setting the base for a multi-phase recovery. The stock ground higher through the spring and summer of 2024, closing the year at €189.10 on 30 December 2024 – a relatively modest finish that masked a steadier underlying uptrend.
2025 proved far more eventful. SIE climbed from €188.95 at the start of January to a peak intraday level of €276.10 on 12 February 2026, driven by strong Q1 FY2026 results and a raised full-year profit outlook. Before that, the shares suffered a sharp drawdown in April 2025 amid broader market stress, touching an intraday low of €162.65 on 7 April 2025 – the weakest point across the two-year window. The stock recovered firmly through the second half of 2025, closing the year at €239.35 on 30 December 2025, a gain of approximately 26.6% over the calendar year.
In early 2026, the post-results rally faded quickly. SIE opened the year at €241.35 on 2 January 2026 and has since pulled back as investor caution around the planned Healthineers restructuring has weighed on sentiment. SIE closed at €228.55 on 11 March 2026, approximately 5.3% down year to date, but 1.8% up year on year.
Past performance is not a reliable indicator of future results. Share prices are indicative and may differ from live market prices.
Siemens (SIE): Capital.com analyst view
Siemens' price action over the past two years reflects a company navigating both strong operational momentum and meaningful structural change. The Q1 FY2026 results, which saw orders rise 10% year-on-year to €21.4 billion and revenue grow 8%, alongside a raised full-year EPS guidance range of €10.70–€11.10, demonstrate operational momentum in the automation, digital industries, and data centre segments. The ongoing NVIDIA partnership on an industrial AI operating system and a record €120 billion order backlog provide context for the investment case; however, the same results triggered a share price decline rather than a sustained rally, illustrating that strong fundamentals do not automatically translate into price appreciation when investor focus is elsewhere.
The planned reduction of Siemens' controlling stake in Healthineers – toward below 20% in the medium term – is the most consequential near-term variable. Some analysts argue the move could simplify the investment case and remove a valuation overhang, potentially re-rating the core industrial and software businesses higher; others flag execution risk, tax uncertainty, and the need for Healthineers to refinance up to €13.9 billion in Siemens-backed loans, a process that could add material costs through 2028. Until transaction terms are confirmed, this structural uncertainty is likely to remain a competing force against the group's otherwise improving earnings trajectory.
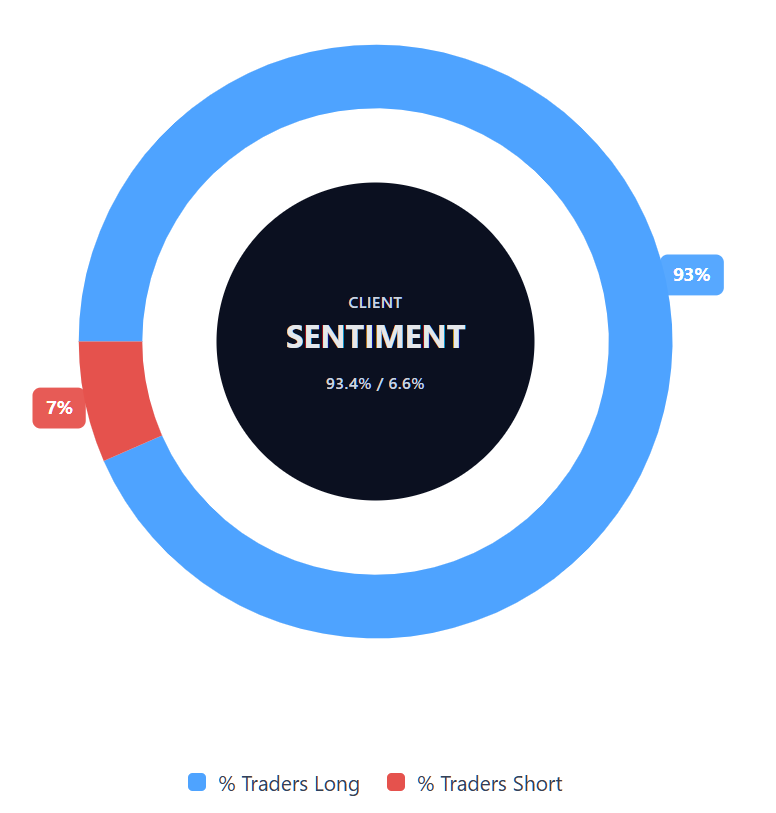
Capital.com’s client sentiment for Siemens CFDs
As of 11 March 2026, Capital.com client positioning in Siemens CFDs stands at 93.4% buyers vs 6.6% sellers, a net-long difference of 86.8 percentage points. This snapshot reflects open positions on Capital.com and can change rapidly as market conditions evolve.
Summary – Siemens 2026
- Siemens (SIE) trades at €228 as of 10:12am UTC on 11 March 2026, down around 5.3% year to date from €241.35 at the start of 2026.
- Over the past two years, SIE has gained approximately 24.9% from the €183 area in March 2024, with an intraday low of €162.65 recorded on 7 April 2025.
- All key moving averages sit above the current price in a uniform sell configuration; the 14-day RSI reads 41.53, a lower-neutral reading without strong buying pressure.
- The classic pivot point at €251.60 is the first meaningful topside reference; initial downside support sits near €227.45, closely aligned with the session low of €226.75.
- Key drivers include AI-driven data centre and automation order growth, a record €120 billion backlog, and an ongoing €6 billion share buyback programme.
- The planned reduction of Siemens' Healthineers stake toward below 20% introduces structural uncertainty around financing, tax, and deal timing that continues to weigh on sentiment.
Past performance is not a reliable indicator of future results.
FAQ
Who owns the most Siemens stock?
What is the 5 year Siemens share price forecast?
Is Siemens a good stock to buy?
Could Siemens stock go up or down?
Should I invest in Siemens stock?
Can I trade Siemens (SIE) CFDs on Capital.com?
Yes, you can trade Siemens CFDs on Capital.com. Trading share CFDs lets you speculate on price movements without owning the underlying asset and to take long or short positions. However, contracts for difference (CFDs) are traded on margin, and leverage amplifies both profits and losses. You should ensure you understand how CFD trading works, assess your risk tolerance, and recognise that losses can occur quickly.