Plug Power stock forecast: DOE loan lawsuit impact
Plug Power is a US hydrogen company that reported first-ever positive gross margin in Q4 2025, while also facing a securities fraud lawsuit announced on 31 March 2026. Past performance is not a reliable indicator of future results. Explore third-party PLUG price targets and technical analysis.
Plug Power (PLUG) is trading at $2.28 as of 3:45pm UTC on 1 April 2026, within an intraday range of $2.03–$2.33. Past performance is not a reliable indicator of future results.
Sentiment around PLUG has been shaped by several converging factors in recent weeks. A securities fraud class action filed by Bleichmar Fonti & Auld LLP, announced on 31 March 2026, alleges that executives misrepresented the likelihood of accessing the company’s $1.66 billion US Department of Energy (DOE) loan and constructing hydrogen production facilities, citing a 17% single-day stock decline in November 2025 as the largest alleged drop in the class period (GlobeNewswire, 27 March 2026).
Separately, Plug Power reported Q4 and full-year 2025 results on 1 March 2026, posting quarterly revenue of $225.2 million for the quarter – ahead of consensus estimates – and recording its first-ever positive gross margin of 2.4%, while also confirming a leadership transition with Jose Luis Crespo assuming the CEO role on 2 March 2026 (Plug Power, 2 March 2026). The company also disclosed asset monetisation agreements with a US data-centre developer expected to generate more than $275 million in liquidity, with closings scheduled across the first half of 2026, alongside previously completed debt restructuring that extended maturities and reduced future interest expense (Investing.com, 26 February 2026).
Plug Power stock forecast 2026–2030: Third-party price targets
As of 1 April 2026, third-party Plug Power stock predictions reflect a cautious but divided consensus, with 12-month price targets spanning $0.75–$7. The central debate is whether Q4 2025 margin improvements signal a durable inflection or a one-off event amid ongoing cash burn and legal uncertainty.
MarketBeat (broker consensus)
MarketBeat reports a consensus Hold rating on PLUG, with an average 12-month price target of $3 across the covering analyst panel. The figure consolidates ratings from firms that have recently adjusted targets following Q4 2025 results, as the stock crossed its 200-day moving average in the same session (MarketBeat, 20 March 2026).
Simply Wall St (analyst reset overview)
Simply Wall St reports that analyst price targets have shifted to cluster predominantly in the $1–$2 range, with a refined fair value estimate of approximately $2.74. The note attributes the downward revision to reduced 2026 revenue forecasts, execution risk around a positive EBITDA target for Q4 2026, and uncertainty over demand in the material handling and electrolyser markets (Yahoo Finance, 24 March 2026).
Tickernerd (Wall Street aggregate)
Tickernerd aggregates 40 Wall Street analyst ratings for PLUG, producing a median 12-month price target of $2.25 within a range of $0.75–$7. The breakdown shows 5 Buy, 13 Hold, and 3 Sell ratings, with Seaport Global holding the most conservative estimate at $0.75 and HC Wainwright anchoring the top end at $7 (Tickernerd, 31 March 2026).
Benzinga (analyst ratings summary)
Benzinga places the PLUG consensus price target at $3.63 across 30 analysts, noting that the three most recent broker actions, from Jefferies ($1.80, Hold), Wells Fargo ($2, Equal Weight), and HC Wainwright ($7, Buy), produce an average of $3.60 among that trio. The wide dispersion across the full panel reflects sharply divergent assumptions on the pace of hydrogen adoption and the company’s access to government financing (Benzinga, 30 March 2026).
CoinCodex (algorithmic model)
CoinCodex projects an end-of-2026 price of $2.01 for PLUG, based on its algorithmic model, representing a roughly 6.6% decline from levels at the time of the update. The model does not incorporate qualitative analyst assumptions, citing only price- and volume-derived inputs as its basis (CoinCodex, 31 March 2026).
Predictions and third-party forecasts are inherently uncertain, as they cannot fully account for unexpected market developments. Past performance is not a reliable indicator of future results.
PLUG stock price: Technical overview
The PLUG stock price trades at $2.28 as of 3:45pm UTC on 1 April 2026, sitting above all 12 moving averages tracked by TradingView, which collectively register buy signals across the 10- through 200-day tenors. The 20/50/100/200-day simple moving averages sit at approximately $2.24 / $2.14 / $2.18 / $2.11, with price trading above the full stack; the 20-over-50 alignment is intact, keeping the short-term trend structure positive relative to the longer-term base.
Momentum is broadly neutral. The 14-day relative strength index (RSI) reads 54.53, placing it in the upper-neutral band, while the average directional index (ADX) at 20.15 indicates a trend that is present but not yet firmly established, per TradingView data.
To the upside, the classic R1 pivot at $2.60 represents the nearest reference above the current price; a daily close above that level would put the R2 area near $2.94 into view. On the downside, the classic pivot point at $2.16 offers initial support, with the 50- and 200-day simple moving averages at $2.14 and $2.11 forming a nearby moving-average shelf just below; a move under that band would bring the S1 pivot at $1.82 into consideration (TradingView, 1 April 2026).
This is technical analysis for informational purposes only and does not constitute financial advice or a recommendation to buy or sell any instrument.
Plug Power share price history (2024–2026)
PLUG’s stock price opened April 2024 around $3.48, with the stock printing an intraday high of $5.11 on 14 May 2024 – a spike that reversed sharply, closing that same session at $3.64 and marking the highest point in the two-year window. The remainder of 2024 saw a steady grind lower, with PLUG closing the year at $2.17 on 31 December 2024.
The selling accelerated through the first half of 2025. PLUG touched an intraday low of $0.95 on 9 June 2025, its weakest level across the period, before recovering through the summer. A sharp rally in October 2025 carried the stock to an intraday high of $4.75 on 6 October – its second-highest reading in two years – though it could not hold those gains. A DOE loan-related announcement in November 2025 drove a 17% single-day drop, with PLUG printing an intraday low of $1.63 on 18 November 2025, before closing 2025 at $1.99.
PLUG closed at $2.32 on 1 April 2026, approximately 16.6% up year to date and 73.1% up year on year.
Past performance is not a reliable indicator of future results. Share prices are indicative and may differ from live market prices.
Plug Power (PLUG): Capital.com analyst view
PLUG’s price path over the past two years reflects a stock caught between operational progress and persistent structural pressures. The company recorded its first-ever positive gross margin in Q4 2025 and secured asset monetisation deals expected to generate more than $275 million in liquidity, including a $132.5 million agreement with Stream Data Centers announced in February 2026. These developments, alongside a leadership transition and a reported improvement in unrestricted cash to $368.5 million, have supported a partial recovery from the June 2025 intraday low of $0.95. That said, the same period has seen levered free cash flow run at negative $674.6 million over the preceding 12 months, a securities fraud class action filed in late March 2026 related to representations around the suspended $1.66 billion DOE loan, and analyst price targets that span a notably wide range of $0.75–$7, indicating sharply divergent views on the company’s trajectory.
Whether the Q4 2025 margin improvement proves durable or a one-off remains a central question, as the path to positive EBITDA by Q4 2026 depends on consistent execution across hydrogen production volumes, asset sale closings, and cost-reduction targets that have historically proved difficult to meet on schedule.
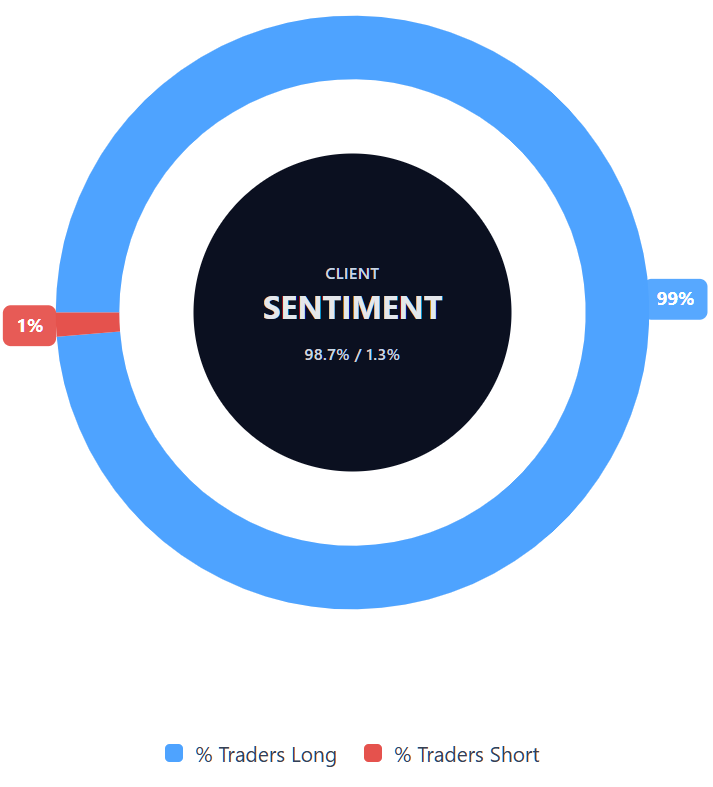
Capital.com’s client sentiment for Plug Power CFDs
As of 1 April 2026, Capital.com client positioning in Plug Power CFDs stands at 98.7% buyers vs 1.3% sellers, which puts buyers ahead by 98 pp and places sentiment firmly in a heavy-buy, one-sided-long territory. This snapshot reflects open positions on Capital.com and can change.
Summary – Plug Power 2026
- PLUG trades at $2.28 as of 3:45pm UTC on 1 April 2026, recovering from a June 2025 intraday low of $0.95 but remaining well below the two-year high of $5.11.
- Key drivers include Q4 2025’s first-ever positive gross margin of 2.4%, a $132.5 million asset sale to Stream Data Centers, and improved unrestricted cash of $368.5 million.
- A securities fraud class action filed on 31 March 2026 alleges misrepresentation around the suspended $1.66 billion DOE loan, adding legal uncertainty alongside ongoing cash burn concerns.
- New CEO Jose Luis Crespo assumed leadership on 2 March 2026, with management targeting positive EBITDA by Q4 2026, a milestone analysts widely describe as a key test of the company’s outlook.
Past performance is not a reliable indicator of future results.
FAQ
Who owns the most Plug Power stock?
What is the 5 year Plug Power share price forecast?
Is Plug Power a good stock to buy?
Whether Plug Power is a good stock to buy depends on an individual’s objectives, risk tolerance and time horizon. The company has reported some operational progress, including a positive gross margin in Q4 2025, but it also faces continuing cash burn, legal uncertainty and execution risk. That combination makes the stock difficult to assess through a simple positive or negative label. Investors and traders usually review both fundamentals and risks before making any decision.
Could Plug Power stock go up or down?
Should I invest in Plug Power stock?
Can I trade Plug Power CFDs on Capital.com?
Yes, you can trade Plug Power CFDs on Capital.com. Trading share CFDs lets you speculate on price movements without owning the underlying asset and to take long or short positions. However, contracts for difference (CFDs) are traded on margin, and leverage amplifies both profits and losses. You should ensure you understand how CFD trading works, assess your risk tolerance, and recognise that losses can occur quickly.