Microsoft stock forecast: Q3 2026 earnings in focus
Microsoft enters its fiscal Q3 2026 earnings release with markets focused on Azure growth, AI spending guidance and the revised OpenAI partnership announced on 27 April 2026. Explore third-party MSFT price targets and technicals. Past performance is not a reliable indicator of future results.
Microsoft Corp. (MSFT) is trading at $427.60 in early European trading as of 11:55am UTC on 29 April 2026, within a session range of $418.87–$429.10. Past performance is not a reliable indicator of future results.
Sentiment ahead of today's after-hours fiscal Q3 2026 earnings release, covering the quarter ended 31 March, is shaping the session, with investors focused on Azure cloud growth and AI capital expenditure guidance as part of a broader 'Magnificent Seven' reporting day that also includes Alphabet, Amazon, and Meta (Invezz, 29 April 2026). The tone has also been influenced by the revised Microsoft-OpenAI partnership announced on 27 April 2026, under which Microsoft's licence to OpenAI intellectual property was extended through 2032 on a non-exclusive basis, ending Microsoft's prior exclusivity over OpenAI's models and capping OpenAI's revenue-share payments to Microsoft through 2030 (CNBC, 27 April 2026).
Third-party Microsoft outlook: Earnings near, targets reset
As of 29 April 2026, third-party Microsoft stock forecasts for 2026–2030 reflect a broad wave of downward revisions driven by AI capital expenditure uncertainty and macro headwinds, though the prevailing consensus rating remains constructive ahead of fiscal Q3 2026 earnings.
Benchmark (individual broker note)
Benchmark reiterates a Strong Buy rating on MSFT with a $450 price target, placing it at the lower end of the current broker range. The firm maintains its view amid cautious near-term sentiment, with the target reflecting a more conservative assessment of AI monetisation timelines relative to peers (Investing.com, 28 April 2026).
Oppenheimer (individual broker note)
Oppenheimer lowers its MSFT price target to $515 from $630, retaining an Outperform rating. Analyst Brian Schwartz cites elevated AI capital expenditure and uncertainty over near-term returns on that investment as the basis for the reduction (Investing.com, 27 April 2026).
Citigroup (individual broker note)
Citigroup trims its MSFT price target to $600 from $635, maintaining a Strong Buy rating. The revision comes amid a sector-wide recalibration of AI infrastructure spending assumptions, while the firm's overall positive stance on Microsoft's cloud and enterprise positioning remains unchanged (MarketScreener, 21 April 2026).
Public.com (consensus overview)
Public.com aggregates a consensus average 12-month price target of $565.28 for MSFT, drawn from 32 analysts, with a Buy consensus rating comprising 38% Strong Buy, 56% Buy, 6% Hold, and zero Sell recommendations. The target range reflects divergent views on Copilot monetisation, Azure capacity, and the pace of AI-related revenue conversion (Public.com, 28 April 2026).
Predictions and third-party forecasts are inherently uncertain, as they cannot fully account for unexpected market developments. Past performance is not a reliable indicator of future results.
Microsoft earnings: Q3 2026 preview
Microsoft is scheduled to release its fiscal year 2026 third-quarter results after the market close on 29 April 2026, with a live earnings conference call beginning at 2:30pm Pacific Time (9:30pm UTC) (Microsoft Investor Relations, accessed 29 April 2026).
Bloomberg consensus places the Q3 estimate at $4.04 earnings per share (EPS) on revenue of $81.46 billion, representing year-on-year revenue growth of approximately 16.2% from the $70.06 billion reported in Q3 2025, with Azure cloud revenue growth expected in the 37%–38% range at constant currency (Yahoo Finance, 29 April 2026). In Q2 fiscal 2026, Microsoft posted EPS of $4.14 against a consensus of $3.86, with revenue of $81.27 billion beating estimates by approximately $1 billion; Azure grew 38% year on year that quarter, but management noted growth could have reached 40% absent capacity constraints (The Street, 27 April 2026).
Azure capacity and AI capital expenditure returns are the key variables in focus, with some analysts noting that the 37%–38% consensus growth bar implies a step-up in new business activity relative to recent trends (Seeking Alpha, 28 April 2026).
Past performance is not a reliable indicator of future results.
MSFT stock price: Technical overview
The MSFT stock price is trading at $427.60 as of 11:55am UTC on 29 April 2026, holding above the short-term moving average cluster while sitting just beneath the 100-day simple moving average (SMA) at $428.01, a level that acted as immediate overhead in the current session. The 20/50/100/200-day SMAs sit at roughly $399 / $395 / $428 / $469, with the last price caught between the 100-day average and the longer-dated 200-day shelf at $469.34. The 20-over-50 alignment remains intact, which keeps the near-term structure constructive on a daily basis.
Momentum appears positive but not stretched: the 14-day relative strength index (RSI) registers 65.38, which TradingView places in firm but not overbought territory, and the average directional index (ADX) at 31.06 signals that an established trend is in place rather than a directionless range.
On the topside, the classic R1 pivot at $403.39 now sits below the current price, with the next classical reference, R2 at $436.60, in view should a daily close above the 100-day SMA at $428.01 hold. On pullbacks, the classic pivot point at $379.83 provides the first support reference, followed by the 50-day SMA shelf near $395. A retreat beneath that band would bring the S1 level at $346.62 into the picture (TradingView, 29 April 2026).
This is technical analysis for informational purposes only and does not constitute financial advice or a recommendation to buy or sell any instrument.
Microsoft share price history (2024–2026)
MSFT’s stock price closed April 2024 at around $390.35, having pulled back from a July 2024 peak of roughly $468 as enthusiasm around the AI-driven rally ran ahead of near-term earnings delivery. The stock recovered through the second half of 2024, closing the year at $421.70 on 31 December 2024, supported by consistent Azure growth and the broader tech rally that followed the US presidential election in November 2024.
Momentum carried into early 2026, with MSFT reaching an intraday high of $484.45 on 28 January 2026 amid strong fiscal Q2 2026 results, when revenue hit $81.3 billion and EPS of $4.14 beat consensus. However, that proved to be a near-term top. A combination of concerns over AI capital expenditure returns, a broader tech sector rotation, and sharp tariff-related market turbulence in early April 2026 sent the stock tumbling to an intraday low of $341.55 on 7 April 2026, a decline of roughly 29% from the January peak.
MSFT has since staged a recovery, closing at $427.53 on 29 April 2026, approximately 25% above that April trough. As of 29 April 2026, the stock is down approximately 11.8% year to date and roughly 8.5% higher year on year.
Past performance is not a reliable indicator of future results. Share prices are indicative and may differ from live market prices.
Microsoft (MSFT): Capital.com analyst view
Microsoft's price trajectory over the past two years reflects both the scale of investor appetite for AI-exposed equities and the sensitivity of high-multiple tech stocks to macro shifts. MSFT rallied from around $390 in April 2024 to an intraday high near $484.45 in late January 2026, driven in part by strong Azure cloud growth and the commercial rollout of Copilot across its enterprise product suite. That said, the same AI narrative cuts both ways: the heavy capital expenditure required to sustain cloud infrastructure expansion has drawn scrutiny over the near-term margin impact, and the revised Microsoft-OpenAI partnership announced on 27 April 2026, which ended exclusivity arrangements, introduces questions about the durability of Microsoft's competitive positioning in generative AI.
The sharp sell-off to an intraday low near $341.55 in early April 2026, amid broad tariff-related market turbulence, illustrated how quickly sentiment can reverse even for large-cap quality names when macroeconomic risk flares. The subsequent recovery towards $427 ahead of fiscal Q3 2026 earnings on 29 April 2026 suggests the market retains a broadly constructive view, though the wide range of analyst price targets ($450–$600) reflects uncertainty about how quickly AI investment translates into revenue.
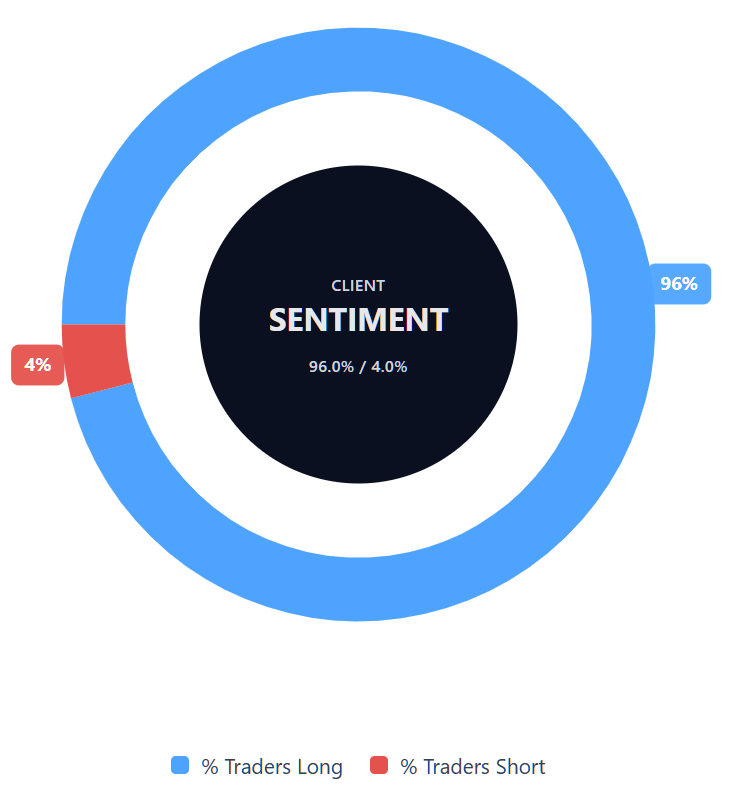
Capital.com’s client sentiment for Microsoft CFDs
As of 29 April 2026, Capital.com client positioning in Microsoft CFDs stands at 96% buyers and 4% sellers, putting buyers ahead by 92 percentage points and placing sentiment firmly in long-biased territory. This snapshot reflects open positions on Capital.com and can change.
Summary – Microsoft 2026
- MSFT is trading at $427.60 as of 11:55am UTC on 29 April 2026, down roughly 11.8% year to date but approximately 25% above its early April 2026 low near $341.55.
- Key drivers include Azure cloud growth, AI capital expenditure sustainability, and the revised Microsoft-OpenAI partnership announced on 27 April 2026, which ended exclusivity arrangements.
- On TradingView, the classic pivot point at $379.83 and the 50-day SMA near $395 are the primary downside references, while the R2 pivot at $436.60 represents the next notable topside level.
Past performance is not a reliable indicator of future results.
FAQ
Who owns the most Microsoft stock?
What is the five-year Microsoft share price forecast?
Is Microsoft a good stock to buy?
Could Microsoft stock go up or down?
Should I invest in Microsoft stock?
Can I trade Microsoft CFDs on Capital.com?
Yes, you can trade Microsoft CFDs on Capital.com. Trading share CFDs lets you speculate on price movements without owning the underlying asset and to take long or short positions. However, contracts for difference (CFDs) are traded on margin, and leverage amplifies both profits and losses. You should ensure you understand how CFD trading works, assess your risk tolerance, and recognise that losses can occur quickly.