Alphabet stock forecast: Q1 2026 earnings in focus
Alphabet is due to report Q1 2026 results after the US market close on 29 April, with investor attention on Google Cloud, Gemini AI, and its planned capital expenditure. Explore third-party GOOG price targets and technical analysis. Past performance is not a reliable indicator of future results.
Alphabet Inc (GOOG) is trading at $346.44 as of 12:12pm UTC on 29 April 2026, within an intraday range of $345.29–$349.99. Past performance is not a reliable indicator of future results.
Wednesday's price action reflects a cautious tone ahead of Alphabet's Q1 2026 earnings release, scheduled after the US market close. Consensus revenue expectations stand at approximately $106.90 billion and EPS at around $2.73 per share, according to Visible Alpha data. Investor focus is on Google Cloud growth, Gemini AI model updates, and the company's 2026 capital expenditure programme, guided at $175 billion – $185 billion (S&P Global, 27 April 2026). The broader backdrop also includes a heavy Nasdaq earnings slate, with Microsoft, Amazon, and Meta reporting on the same day (Business Insider, 29 April 2026), while Alphabet faces a proposed 2.25% digital revenue tax from Australian regulators targeting major platforms, including Google (Benzinga, 29 April 2026).
Third-party Alphabet outlook: Q1 earnings near
As of 29 April 2026, third-party Alphabet stock forecasts for 2026–2030 reflect broadly constructive sentiment. Broker commentary remains centred on Google Cloud acceleration, generative AI monetisation through Gemini, and the resilience of Search advertising revenue.
Public.com (consensus snapshot)
Public.com aggregates ratings from eight analysts covering GOOG and shows a consensus Buy rating, with an average 12-month price target of $354.38. The breakdown shows 50% Strong Buy, 38% Buy, and 13% Hold. The estimate reflects expectations of 15.9% year-over-year Search revenue growth and 43.5% Cloud revenue growth in Q1 2026 (Public.com, 28 April 2026).
MarketBeat (consensus overview)
MarketBeat aggregates data from 39 analysts on GOOG and records a consensus Buy rating with an average 12-month price target of $351.73. The range runs from a low of $220 to a high of $420. That wide spread reflects differing views on the pace of AI-driven Cloud expansion and Alphabet's exposure to EU Digital Markets Act compliance costs (MarketBeat, 27 April 2026).
TD Cowen (analyst note)
Investing.com reports that TD Cowen raised its GOOG price target to $375 from $365, maintaining a Buy rating. The revision cites an expected acceleration in Google Cloud revenue to 50% year-over-year growth in Q1 2026 and continued strength in Search. Alphabet shares were also cited as trading at 28.3x price-to-earnings excluding cash on the firm's 2026 estimates (Investing.com, 16 April 2026).
Mizuho, DBS Bank (two broker targets)
Mizuho raises its GOOG price target to $420 and maintains an Outperform rating. Mizuho projects Google Cloud revenue could reach $149 billion by 2027, supported by the Anthropic partnership and a refined backlog analysis. DBS Bank separately lifted its target to $400 from $360, maintaining a Buy rating and citing an implied upside of 18.75% from the prior close (MarketBeat, 17 April 2026).
Predictions and third-party forecasts are inherently uncertain, as they cannot fully account for unexpected market developments. Past performance is not a reliable indicator of future results.
Alphabet Q1 2026 earnings
Alphabet is scheduled to report Q1 2026 financial results on 29 April 2026 after the US market close, with its quarterly conference call set for 4:30 pm ET (Alphabet IR, 7 April 2026).
Key areas of management commentary that analysts are monitoring include the phasing of Alphabet's $175 billion – $185 billion FY2026 capital expenditure programme, Gemini AI adoption metrics, and whether Q1 EPS can sustain the earnings growth trajectory implied by pre-results consensus. Wall Street consensus, as compiled by Visible Alpha, places Q1 2026 total revenue at approximately $106.90 billion, up from $101.50 billion at the start of the forecast cycle, with consensus EPS at $2.73; the upward revisions reflect higher Google Cloud margin expectations, which range across analyst models from 11.6% to 34% (S&P Global, 27 April 2026).
Past performance is not a reliable indicator of future results.
GOOG stock price: Technical overview
The GOOG stock price is trading at $346.44 as of 12:12pm UTC on 29 April 2026, remaining well above its key moving-average cluster, with the 20/50/100/200-day SMAs sitting at approximately $323 / $310 / $316 / $278 respectively. The price remains comfortably above all four levels, and the 20-over-50 alignment remains intact (TradingView, 29 April 2026). The Hull moving average (9) at $347.63 sits just above the current quote, while the 10-day SMA at $338.63 provides the nearest short-term reference below.
Momentum appears stretched. The 14-day relative strength index stands at 71.34, a level TradingView's oscillator data places above the conventional 70 overbought threshold, suggesting the recent advance has been sharp. The average directional index at 31.99 indicates that an established trend is in place, consistent with the directional structure visible across the moving-average stack.
On the topside, the classic R1 pivot at $308.11 has already been cleared. The R2 pivot at $329.36 is also below the current price, leaving the R3 level at $368.89 as the nearest overhead classic pivot. To the downside, the classic pivot point at $289.82 represents the first structural reference, followed by the 100-day SMA near $316 as the closest moving-average support area. A retreat through that zone would bring the S1 pivot at $268.57 into consideration (TradingView, 29 April 2026).
This is technical analysis for informational purposes only and does not constitute financial advice or a recommendation to buy or sell any instrument.
Alphabet share price history (2024–2026)
GOOG’s stock price began 2025 trading near $190, after closing 2024 at $191.04 on 31 December. The stock moved higher through early 2025 and reached the $200 range in January, before peaking near $211 in early February following Q4 2024 earnings, when Alphabet reported full-year revenue of more than $400 billion, according to Forbes.
That move proved difficult to sustain. GOOG fell sharply through spring 2025 and touched $144.35 on 9 April 2025, its lowest point in the two-year period, as broader market volatility intensified amid US tariff concerns and macroeconomic uncertainty. The stock then recovered through the summer, climbed back above $250 by late October, and moved above $300 again in early November.
GOOG ended 2025 at $313.93, up about 64% over the year. Momentum carried into 2026, with the share price rising above $340 in mid-January before pulling back towards $310 in February. A sharper decline followed in late March, taking the stock to a 2026 low of $271.57 on 30 March. By 29 April 2026, GOOG had rebounded to close at $346.13.
Past performance is not a reliable indicator of future results. Share prices are indicative and may differ from live market prices.
Alphabet (GOOG): Capital.com analyst view
Alphabet's price performance over the past two years reflects both the durability and the volatility of large-cap technology stocks navigating a rapidly shifting AI landscape. GOOG climbed from around $165 in April 2025 to above $346 by late April 2026, a gain of more than 100% over 12 months, driven in part by accelerating Google Cloud revenue, Gemini AI adoption, and a broader Nasdaq recovery. That said, the path was far from smooth: the stock shed roughly 30% from its early February 2026 high of approximately $349 to a March low near $271, coinciding with macro uncertainty and tariff-related risk-off sentiment. This move shows how elevated valuations can amplify drawdowns when broader conditions deteriorate.
Looking at current conditions, Alphabet faces a concentrated set of catalysts in both directions. Its Q1 2026 earnings, due after market close on 29 April 2026, could reinforce the Cloud and Search growth narrative, but a miss against consensus expectations of approximately $106.90 billion in revenue could quickly unwind the recent recovery. Meanwhile, Alphabet's $175 billion–$185 billion capital expenditure commitment for 2026 signals conviction in its AI infrastructure build-out. Some market participants may view this as a sign of long-term competitive positioning, while others may focus on the near-term pressure it could place on free cash flow and margins.
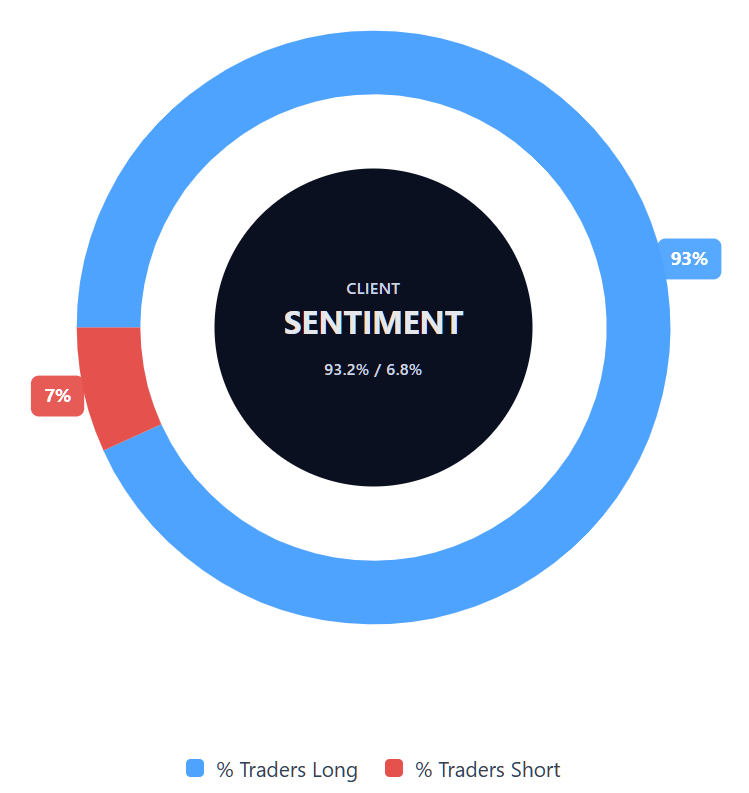
Capital.com’s client sentiment for Alphabet CFDs
As of 29 April 2026, Capital.com client positioning in Alphabet CFDs sits at 93.2% buyers and 6.8% sellers, putting buyers ahead by 86.4 percentage points and placing the market firmly in heavy-buy, one-sided-towards-longs territory. This snapshot reflects open positions on Capital.com at the time of writing and can change rapidly as market conditions evolve.
Summary – Alphabet 2026
- Alphabet (GOOG) trades at $346.44 as of 12:12pm UTC on 29 April 2026, up over 100% year on year from April 2025 lows near $144.35.
- Key drivers include Google Cloud acceleration, Gemini AI monetisation, Search advertising resilience, and Alphabet's $175 billion–$185 billion capital expenditure commitment for 2026.
- On TradingView, the 14-day relative strength index stands at 71.34, above the conventional 70 threshold, indicating that momentum is stretched, while the average directional index at 31.99 suggests that an established trend is in place.
Past performance is not a reliable indicator of future results.
FAQ
Who owns the most Alphabet stock?
What is the five-year Alphabet share price forecast?
Is Alphabet a good stock to buy?
Could Alphabet stock go up or down?
Should I invest in Alphabet stock?
Can I trade Alphabet CFDs on Capital.com?
Yes, you can trade Alphabet CFDs on Capital.com. Trading share CFDs lets you speculate on price movements without owning the underlying asset and to take long or short positions. However, contracts for difference (CFDs) are traded on margin, and leverage amplifies both profits and losses. You should ensure you understand how CFD trading works, assess your risk tolerance, and recognise that losses can occur quickly.