Stellantis stock forecast: FaSTLAne 2030 and tariffs
Stellantis is a Milan-listed automaker whose 2026 outlook is tied to its FaSTLAne 2030 plan, €1bn Peugeot EV investment and US tariff exposure. Explore third-party STLAM price targets and technical analysis. Past performance is not a reliable indicator of future results.
Stellantis N.V. (STLAM) is trading at €6.13 in early European trading on 8 June 2026, within an intraday range of €6.03–€6.45, and below the €6.72 close recorded on 26 May 2026.
Sentiment around the stock has been shaped by several concurrent developments. Stellantis unveiled its FaSTLAne 2030 strategic plan at its Investor Day on 21 May 2026, targeting revenue growth from €154bn in 2025 to €190bn by 2030 and an adjusted operating income (AOI) margin of 7% by 2030, while committing to a €60bn investment programme over five years (Stellantis, 21 May 2026). The automaker also announced a €1bn investment in three new Peugeot electric and hybrid models at its Mulhouse plant as part of that electrification push (Simply Wall St, 3 June 2026). In addition, the company's full-year results disclosed in February 2026 flagged estimated US tariff exposure of €1.60bn for 2026, up from €1.2bn in 2025 (Financial Times, 25 February 2026). Past performance is not a reliable indicator of future results.
Third-party Stellantis outlook: FaSTLAne 2030 and tariff risk
As of 8 June 2026, third-party Stellantis stock predictions reflect a wide range of views. These have been shaped primarily by the FaSTLAne 2030 strategic plan unveiled at the 21 May Investor Day, the group's negative free cash flow guidance for 2026, US tariff exposure, and competitive pressure from Chinese electric vehicle makers. The following targets summarise leading third-party predictions from that window.
Bank of America (downgrade to Underperform)
Bank of America downgraded Stellantis to Underperform from Neutral and assigned a 12-month price target of €5.50, citing an unproven recovery trajectory and intensifying competitive pressure from Chinese EV manufacturers as the principal reasons for the revision (Yahoo Finance, 11 May 2026).
Jefferies (Buy reiteration)
Jefferies analyst Philippe Houchois maintained a Buy rating on Stellantis with a 12-month price target of €9.50, following the group's FaSTLAne 2030 Investor Day presentation (The Globe and Mail, 27 May 2026).
MarketScreener (panel consensus)
MarketScreener aggregates 27 analysts covering Milan-listed STLAM and records a mean Hold consensus, with an average 12-month price target of €7.86, a high estimate of €12.50, and a low of €4. Post-Investor Day activity on 22 May included a Neutral reiteration from Barclays and Buy reiterations from both JP Morgan and UBS (MarketScreener, 27 May 2026).
Morgan Stanley (target lift)
Morgan Stanley raised its 12-month price target on Stellantis to €7.10 from €6.50, while maintaining an Equal Weight rating on the shares. The bank cited a reassessment of near-term estimates following the Investor Day disclosures (MarketBeat, 3 June 2026).
Public.com (aggregate view)
Public.com compiles five analyst ratings on NYSE-listed STLA and records a Buy consensus with a 12-month average price target of $11.59. The panel comprises 20% Strong Buy, 20% Buy, and 60% Hold ratings, with no active Sell recommendations (Public.com, 4 June 2026).
Predictions and third-party forecasts are inherently uncertain, as they cannot fully account for unexpected market developments. Past performance is not a reliable indicator of future results.
Stellantis earnings: latest results and upcoming dates
Stellantis reported its Q1 2026 financial results on 30 April 2026, with the figures released before the US market open and followed by a conference call at 8am EDT (MarketBeat, 23 April 2026). The next scheduled earnings event is the Q2 2026 financial results, due on 30 July 2026, according to the company's published investor calendar (Stellantis IR, 8 June 2026).
At the Q1 stage, Stellantis had not reinstated full-year guidance, having suspended it in April 2025 amid US tariff uncertainty. Instead, management reiterated the FaSTLAne 2030 framework targets presented at the 21 May 2026 Investor Day, which include revenue growth from €154bn in 2025 to €190bn by 2030 and a return to positive free cash flow by 2027 (Stellantis, 21 May 2026). The group also recorded approximately €22.2bn in charges excluded from adjusted operating income (AOI) for the second half of 2025 as part of its strategic reset, a figure disclosed in the full-year 2025 results published in February 2026 (Stellantis, 26 February 2026).
Past performance should never be relied upon as a definitive indicator of future trends.
STLAM stock price: technical overview
The STLAM stock price is trading at €6.13 as of 10:13am UTC on 8 June 2026, below all major moving averages on the daily chart. The 20-, 50-, 100- and 200-day simple moving averages (SMAs) sit at approximately €6.53, €6.59, €6.74 and €7.82, respectively, forming a stacked overhead resistance band. With the 20-day SMA beneath the 50-day SMA, the cluster shows a bearish alignment. The Hull moving average (9) at €6.12 tracks closely with the current price, reflecting limited separation between short-term trend and spot price.
Momentum indicators also point to a cautious technical setup. The 14-day relative strength index reads 38.5, placing it in near-oversold territory without reaching the conventional oversold signal below 30. The average directional index at 13.8 sits below the 15 threshold, indicating a weak and directionless trend environment rather than a clearly established downtrend.
On the upside, the classic pivot at €6.66 marks the first reference level above the current price. A daily close through that level would put the R1 pivot near €7.37 in view, with R2 at €7.86 as a further reference. To the downside, S1 sits at €6.16, close to current levels, while S2 at €5.46 would be the next meaningful area to monitor if near-term support gives way (TradingView, 8 June 2026).
This is technical analysis for informational purposes only and does not constitute financial advice or a recommendation to buy or sell any instrument.
Stellantis share price history (2024–2026)
STLAM’s stock price traded above €20 in early June 2024, during a period when the group was still widely regarded as a lean, cash-generative turnaround. That level didn’t hold. The stock lost roughly a third of its value through the second half of 2024, closing the year near €12.60, as profit warnings and deepening concerns about US market share loss weighed on sentiment.
The decline continued into 2025. After touching €12.91 in late February, a combination of CEO transition uncertainty, a suspended dividend, and mounting US tariff exposure pushed the stock below €9.50 by early April 2025, before a partial recovery lifted it back towards €9.82 in May. It spent much of mid-2025 consolidating in the €8–€9 range, then declined again into year-end, closing 2025 near €9.49.
2026 opened near €9.71, but selling pressure intensified. Stellantis disclosed approximately €22.2bn in strategic reset charges in February, and the stock fell sharply, dropping around 24% in a single session on 6 February, from €8.21 to €6.23. It hit a two-year low of €5.67 on 23 March 2026 before recovering to €7.46 by mid-April, partly alongside stabilising macro sentiment and Q1 results. A second move higher reached €7.10 on 27 May, coinciding with the FaSTLAne 2030 Investor Day, though gains have since faded. STLAM closed at €6.17 on 8 June 2026, approximately 36.5% lower year to date and 29.5% lower year on year, and around 70% below its June 2024 peak.
Past performance is not a reliable indicator of future results. Share prices are indicative and may differ from live market prices.
Stellantis (STLAM): Capital.com analyst view
Stellantis (STLAM) has undergone a prolonged de-rating since mid-2024, with the stock trading well below its former levels amid restructuring charges, US tariff headwinds, and competitive pressure in the electric vehicle segment. The FaSTLAne 2030 strategic plan, unveiled in May 2026, sets out revenue and margin targets that could, if delivered, support a valuation re-rating over time. However, the group’s own guidance points to negative free cash flow through 2026, leaving near-term execution risk as an ongoing concern.
The wide spread of analyst price targets, from €5.50 to €9.50 across brokers active in May–June 2026, illustrates how divided opinion remains on the pace and credibility of the turnaround. More constructive views cite low valuation, the new model pipeline, and a refreshed leadership team. More cautious views point to unproven recovery assumptions, Chinese EV competition in the European market, and continued tariff exposure in North America. Both sets of arguments carry weight, and outcomes may depend heavily on the group’s H1 2026 results, due 30 July 2026.
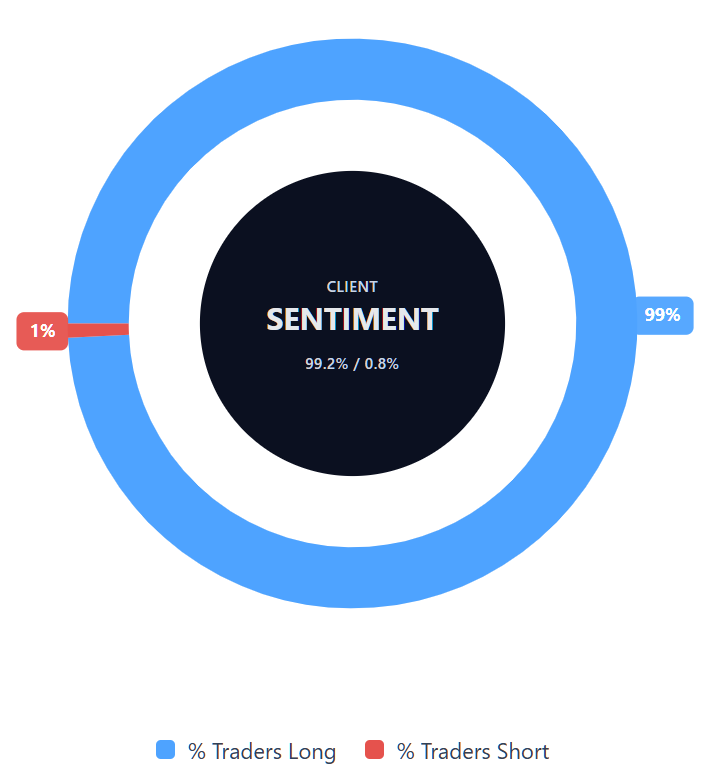
Capital.com’s client sentiment for Stellantis CFDs
As of 8 June 2026, Capital.com client positioning in Stellantis CFDs stands at 99.2% buyers versus 0.8% sellers, putting buyers ahead by 98.4 percentage points and placing sentiment in strongly long-positioned territory. This snapshot reflects open positions on Capital.com and can change.
Summary – Stellantis 2026
- As of 10:13am UTC on 8 June 2026, Stellantis (STLAM) was trading at €6.13, within an intraday range of €6.03–€6.45.
- Key price drivers include estimated US tariff exposure of €1.6bn for 2026, restructuring execution risk, and competitive pressure from Chinese EV manufacturers in Europe.
- The FaSTLAne 2030 strategic plan, unveiled on 21 May 2026, targets revenue of €190bn and positive free cash flow by 2027, although near-term guidance remains negative on free cash flow.
- Stellantis committed more than €1bn to produce three new Peugeot electric and hybrid models in France, signalling continued electrification investment alongside the broader turnaround effort.
Past performance is not a reliable indicator of future results.
FAQ
Who owns the most Stellantis stock?
Stellantis’ shareholder base includes long-term strategic investors as well as institutional holders. Based on company ownership disclosures, Exor, the Agnelli family’s investment company, has historically been the largest single shareholder, followed by other major holders including Peugeot Invest and Bpifrance. Ownership can change over time, so traders should check the latest company filings and investor relations updates before using shareholder structure as part of their research.
What is the five-year Stellantis share price forecast?
The article focuses on 12-month third-party analyst targets, rather than a five-year STLAM stock forecast. Those targets show a wide range of views, with EUR-denominated estimates spanning €5.50–€9.50. Longer-term forecasts would depend on factors including delivery of the FaSTLAne 2030 plan, free cash flow recovery, US tariff exposure, and competition in the electric vehicle market.
Is Stellantis a good stock to buy?
Whether Stellantis is a good stock to buy depends on your objectives, risk tolerance, market view, and timeframe. The article shows a divided analyst picture: some brokers cite low valuation, the new model pipeline, and management changes, while others point to execution risk, tariff exposure, and competition from Chinese EV makers. Analyst forecasts are not guarantees, and past performance should never be relied upon as a definitive indicator of future trends.
Could Stellantis stock go up or down?
Stellantis stock could move in either direction. A stronger-than-expected recovery in free cash flow, progress on the FaSTLAne 2030 plan, or resilient demand for new electric and hybrid models could support the share price. However, weaker earnings, higher tariff costs, delayed restructuring progress, or further competitive pressure could weigh on the stock. CFD traders should also remember that leverage can magnify both profits and losses.
Should I invest in Stellantis stock?
This article doesn’t provide investment advice or a recommendation to invest in Stellantis stock. Any decision should be based on your own research, financial situation, and understanding of the risks. You may want to review company results, analyst forecasts, sector conditions, and your own exposure before making a decision. For CFD traders, it’s also important to consider leverage, margin requirements, and risk-management tools before opening a position.
Can I trade Stellantis CFDs on Capital.com?
Yes, you can trade Stellantis CFDs on Capital.com. Trading share CFDs lets you speculate on price movements without owning the underlying asset and to take long or short positions. However, contracts for difference (CFDs) are traded on margin, and leverage amplifies both profits and losses. You should ensure you understand how CFD trading works, assess your risk tolerance, and recognise that losses can occur quickly.